


Orb Analytics Week 13 Recap – George Pickens trolled our models


The Orb’s performance slide continued in Week 13. A 2-2 Sunday against the spread felt like a win compared to the last two weeks, but unfortunately, it was not able to make up for a 0-2 Thanksgiving record as our models missed on the Lions and the Giants. By definition, this project is going to have a worst stretch ever, and to date, we are certainly in it. Anyone who sports bet has gone through their own version of a cold streak and knows how helpless it feels. Any time you make a pick it just seems to miss and there's nothing you can do. One benefit of a data-driven approach to predicting spreads is that we can look through poor performances like this one and try to update the models to learn from them. While it is harder to avoid misses live week-to-week, the worst mistake we can make now is not trying to gain insight into why the model’s performance has dipped.
For the first time since our first week of the season in Week 2, the Orb is now sitting below our season target accuracy of 52.4% by 0.1%. So if the season ended today, this would officially be an unsuccessful one by our main Northstar metric. The recent performance is discouraging not because it feels like we threw away a good first half of the season but rather because a large emphasis of my offseason was implementing modeling strategies to avoid repeating what we saw last season. Last season we similarly had a fantastic first half of the year. The Orb’s performance trended upward until ‘peaking’ around weeks 10-11 and slowly moving downward in the latter half of the year. So this offseason I *tried* my best to make changes that could lead to steadier performance throughout the season rather than being as volatile. Clearly, these changes didn’t end up working! So while we are essentially right at our target for the season, I am more disappointed in how the model got here than the fact that it won’t come close to repeating last season’s 58.2% accuracy against the spread. Not that that was ever our goal.
A bad cold streak doesn’t change our mission of trying to use data and predictive analytics to rebalance the odds of a game that is rigged against the player by the sportsbook. We are attempting to create sustainable long-term success but understand that this game unfortunately can be seen as ‘what have you done for me lately.’ And we never hide from negative results when the models miss, so in our record-setting down performance over the last few weeks, we understand more than anyone that ‘what the Orb has done lately’ is miss more than it has hit. When we zoom out over a larger sample of the season as a whole, or more so the Orb’s entire record over the years, we aim for that not to be the case.
Here is how each pick performed in week 13:
Spreads:
Lions -9.5 (Thanksgiving Day Special) ❌
Giants +3.5 (Thanksgiving Day Special) ❌
Patriots +2.5 ✅
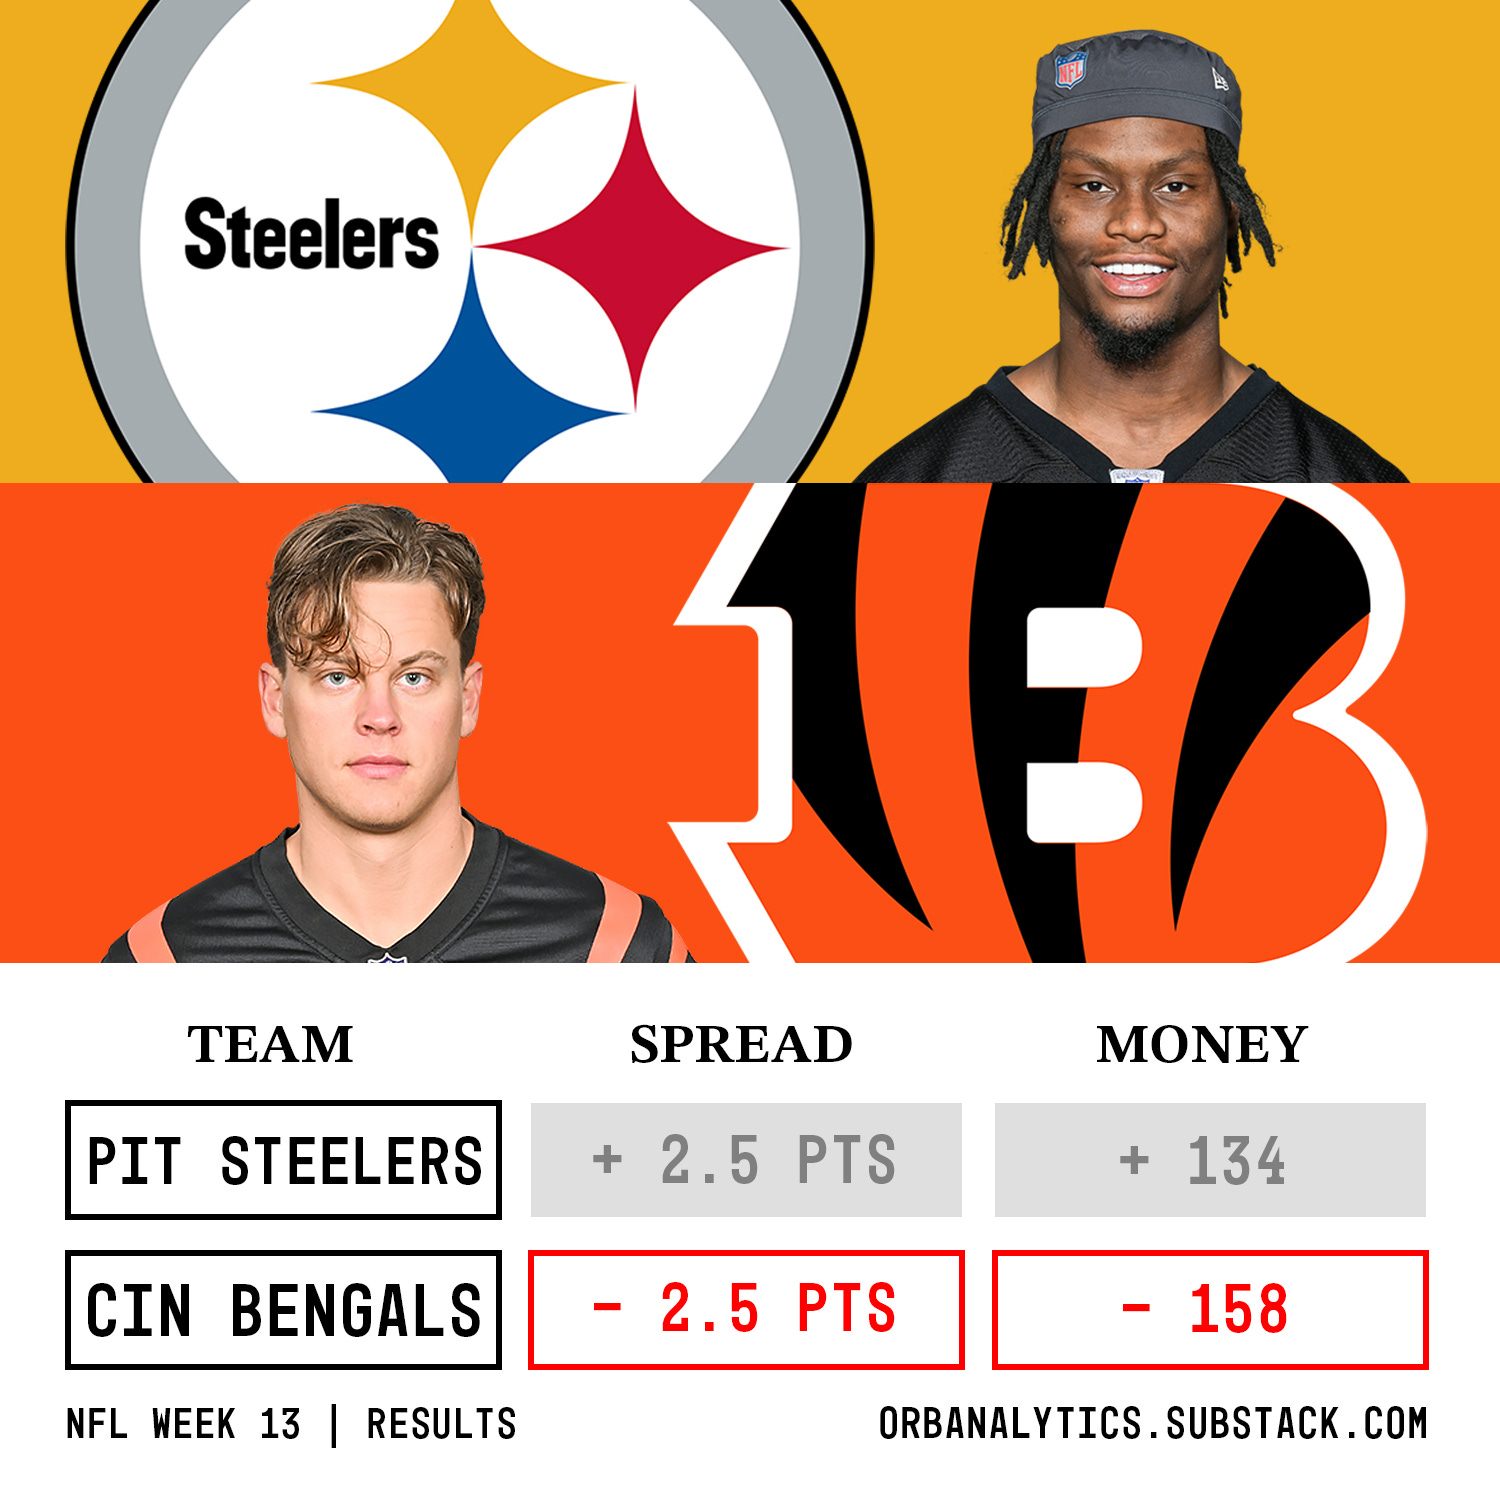
Bengals -2.5 ❌
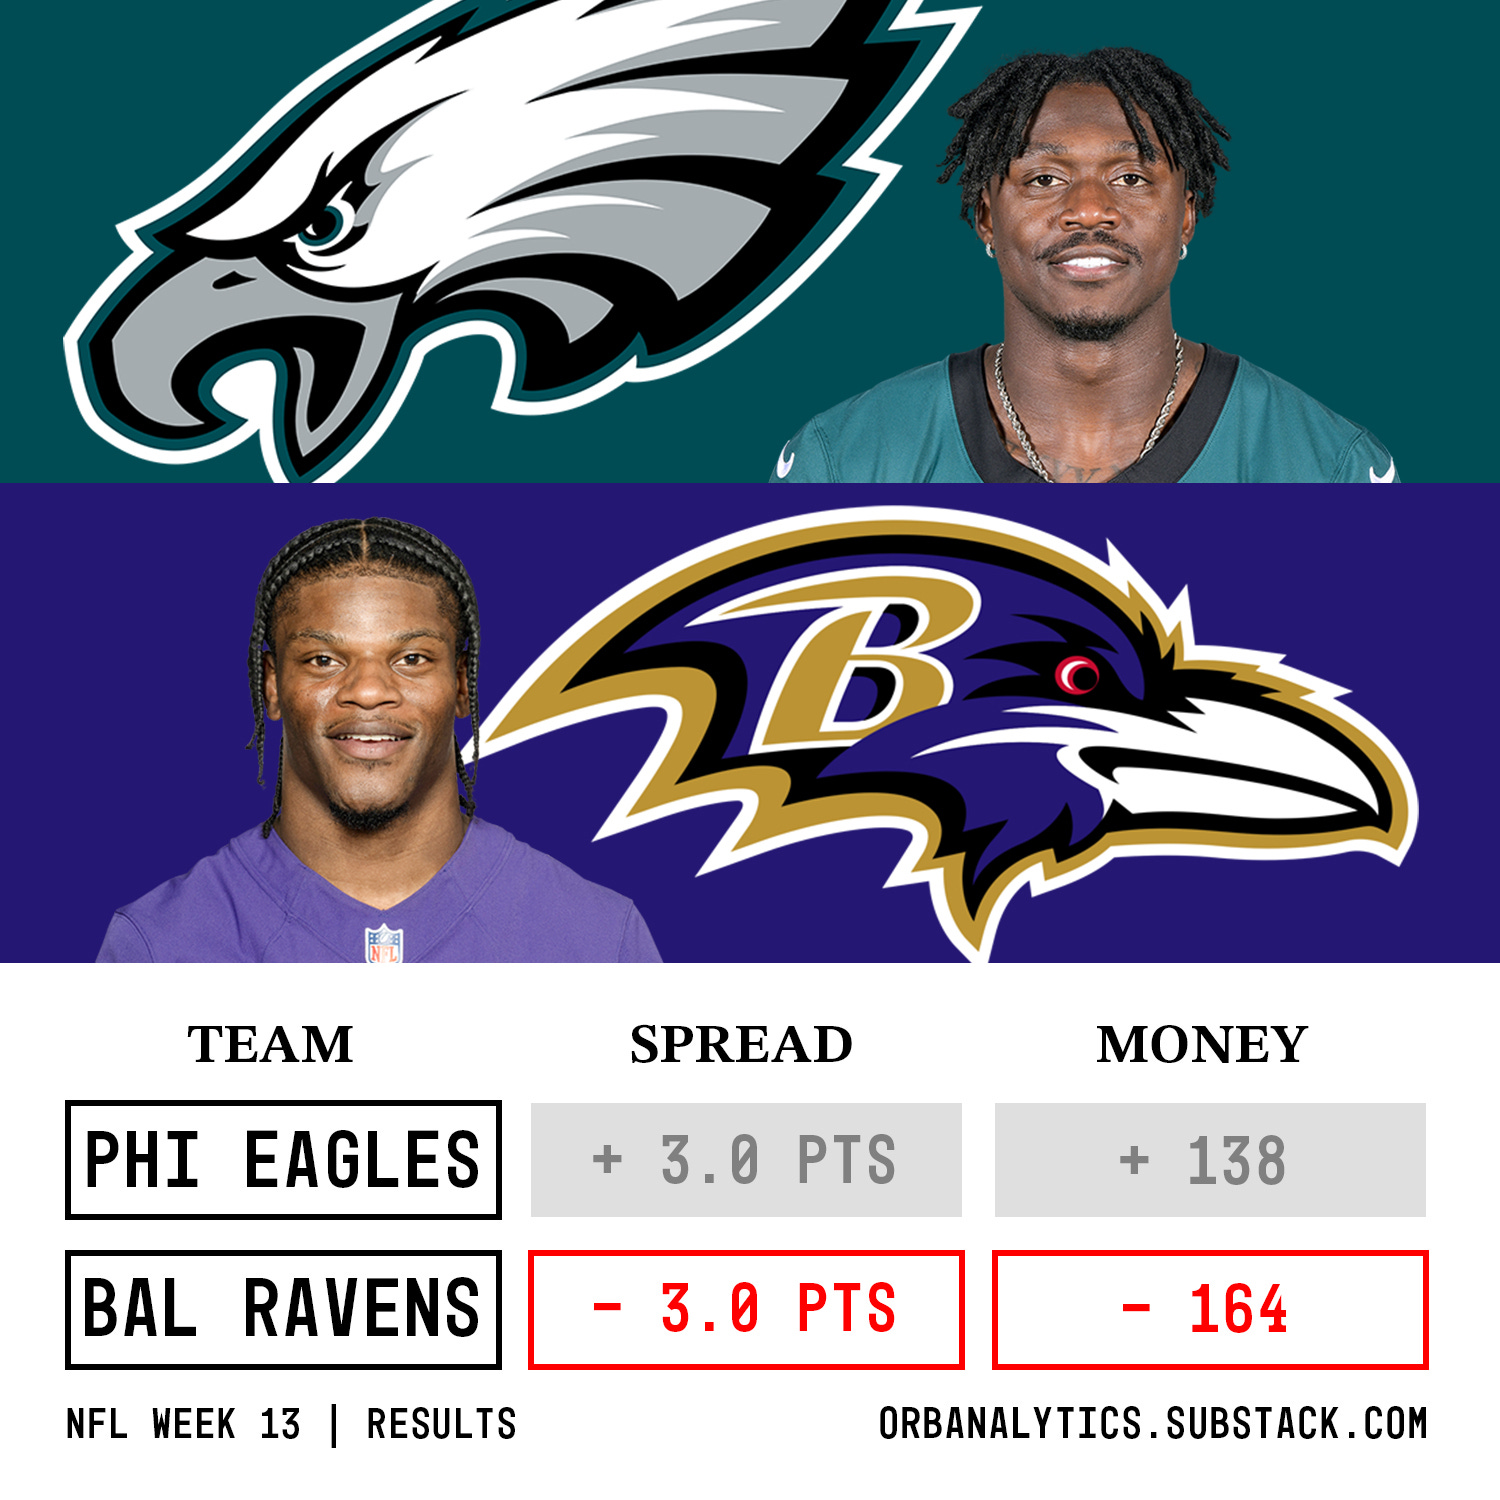
Ravens -3 ❌
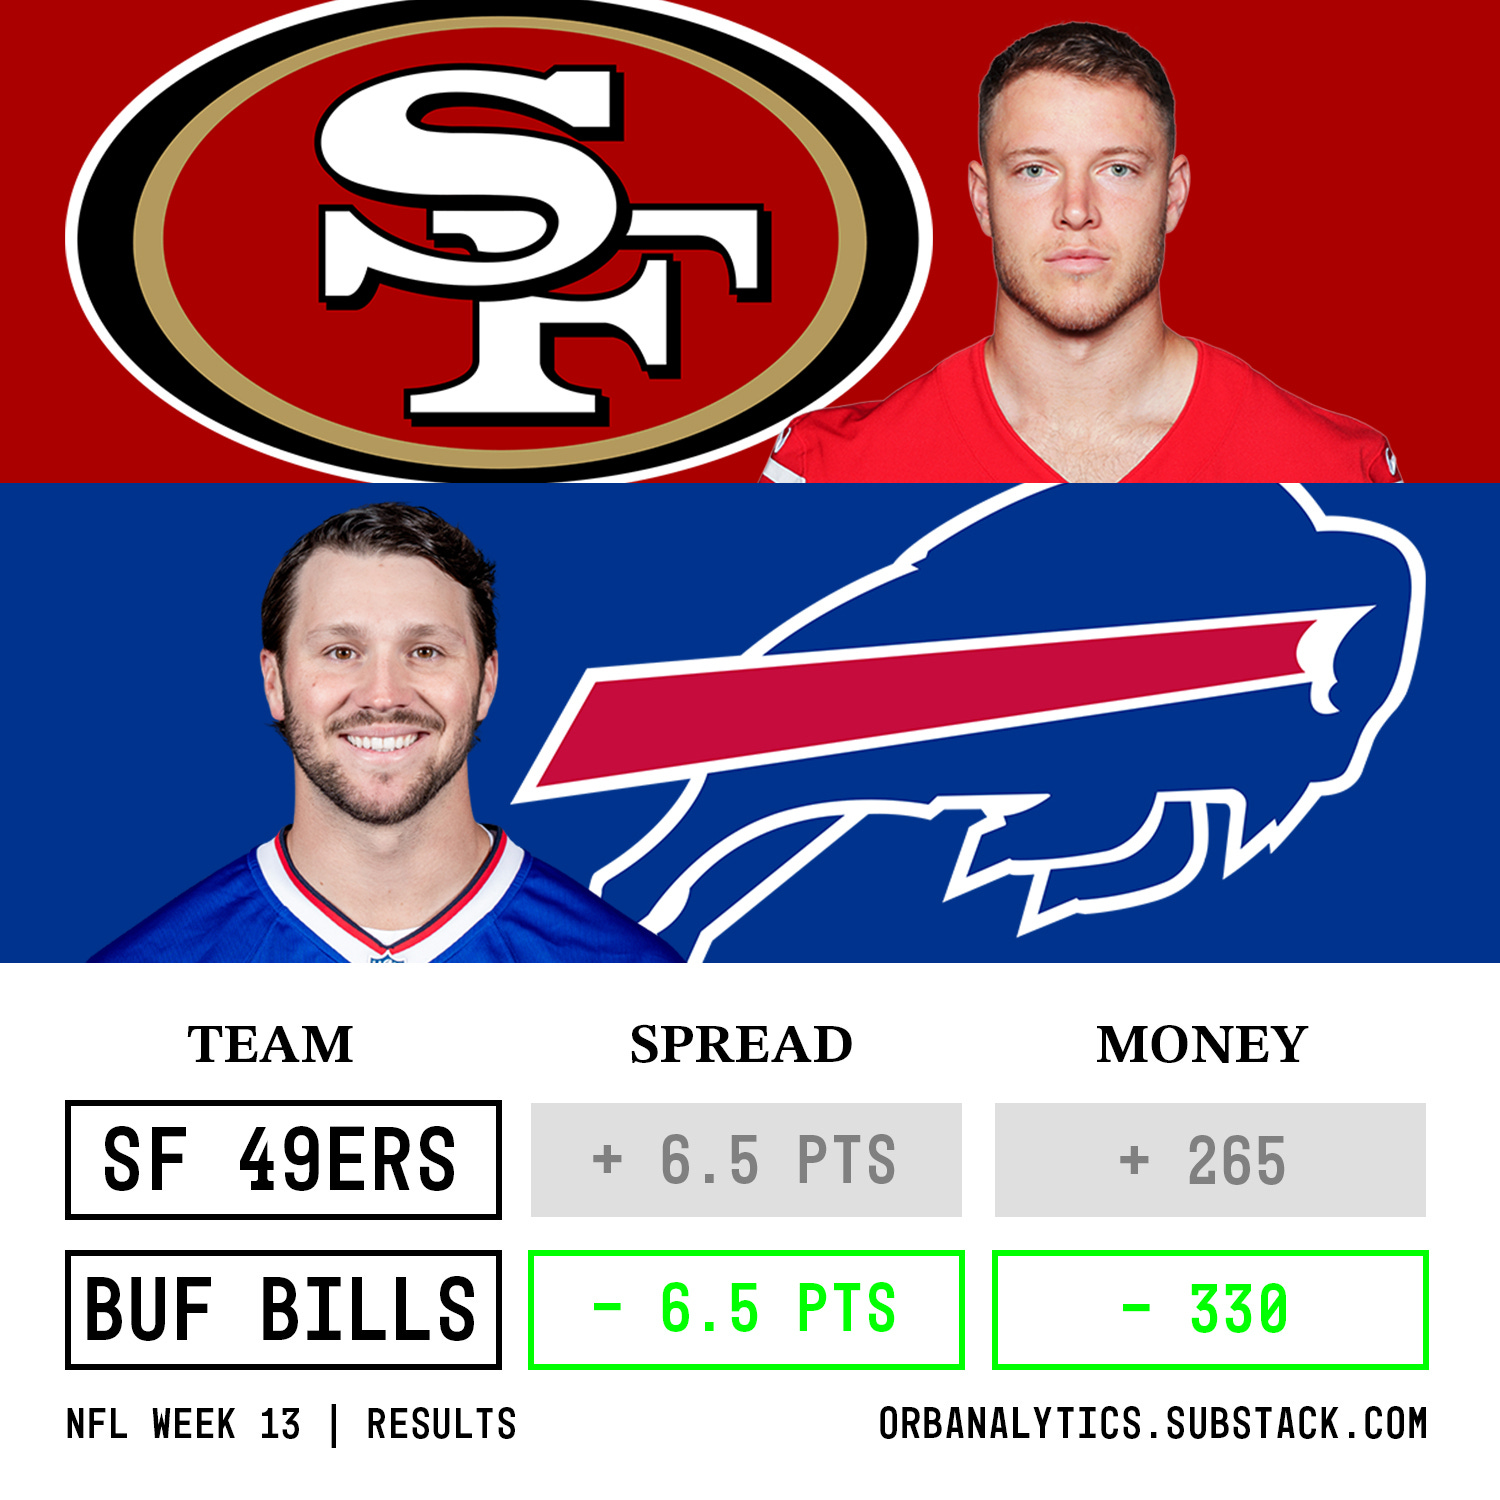
Bills -6.5 ✅
All spreads: 2-4, 33.3%, -2.182 units
Moneyline:
Lions (Thanksgiving Day Special) ✅
Packers (Thanksgiving Day Special) ✅
Chiefs (Thanksgiving Day Special) ✅
Seahawks ✅
Bengals ❌
Commanders ✅
Vikings ✅
Ravens ❌
Bills ✅
Broncos (MNF - Premium) ✅
All moneyline, 8-2, 80.0%, +1.319 units
Overall a -0.863 unit performance.
Week 13 Model Performance:
Favorites covered 8/16 games (50.0%) and won 14/16 outright (87.5%).
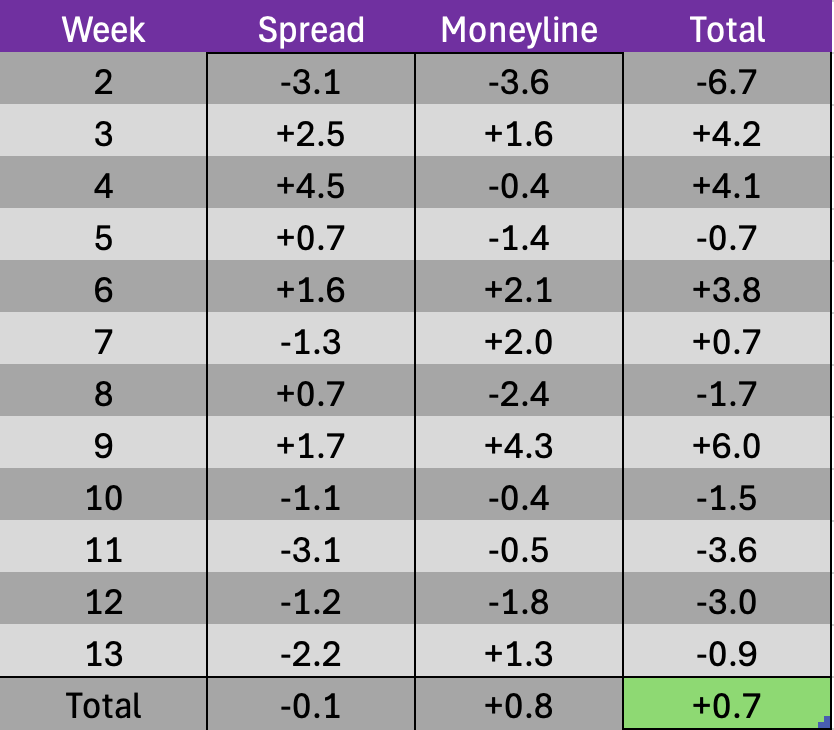
Weekly spreads:

Weekly Moneyline:

Season-To-Date Model Performance:
Not including week 1, favorites have covered 94/179 games (52.5%) and won 124/179 (67.5%) outright this season.
Season spreads:
Season moneyline:

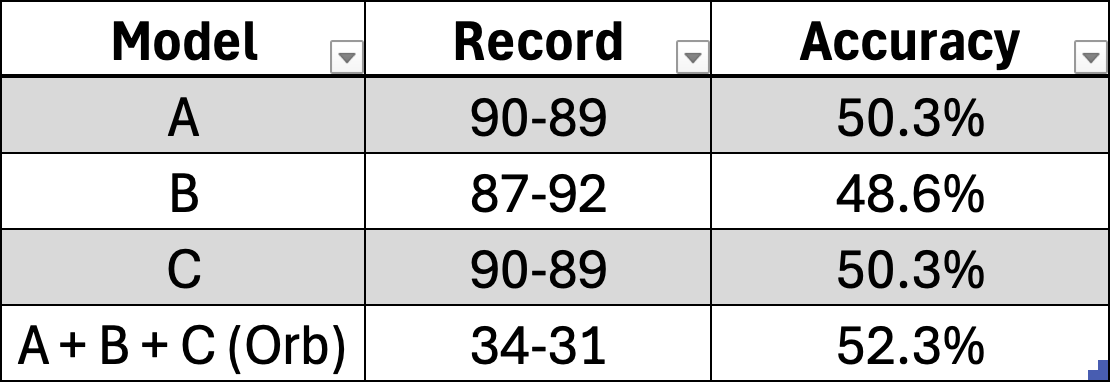
Official Orb Picks Season Results:
Season spread picks: 34-31, 52.3%, -0.1 units
Season moneyline picks: 74-36, 67.3%, +0.8 units

Confusion Matrix:

An ever so slight positive from this week is that our moneyline models had a +unit performance! We put significantly less emphasis on the moneyline model compared to our main focus of spread picks but in a dark time for the project, we want to highlight something positive. And positive is exactly how Andy Diamonds and I are staying for the rest of the season. Yes, we would love to have recent weeks back to perform better, but we are right at our season accuracy goal with more football ahead of us to try and end up on the right side of the 52.4% profitability line against the spread.
NFL Fan Poll: Who is your MVP through Week 13?
- Team Orb Analytics
.
.
.
.
.
.
DISCLAIMER:
The information provided on this website is for informational purposes only. It is not intended to be gambling or financial advice, and should not be relied upon as such. We are not responsible for any actions or decisions taken by readers based on the information provided on this website.
The picks and predictions provided on this website are based on our own research and analysis, and are intended to be used for entertainment and informational purposes only. We do not guarantee the accuracy or completeness of the information provided, and we are not responsible for any losses or damages incurred as a result of using this information for gambling or other purposes.
By accessing and using this website, you acknowledge and agree to the terms of this disclaimer, and you assume all risks and liabilities associated with your use of the information provided on this website.