


2024 Orb NFL Kickoff

Welcome to the 2024 NFL Orb season! After a long summer without Football, it is finally that time of year to cancel Sunday plans and fire up the Orb again. Just because there has been no NFL does not mean Andy Diamonds and I have been sitting around neglecting this project. It's been quite the opposite, as we followed our most successful football season yet with our most productive offseason. There is so much we are excited to bring you this season and cold intros are not my strong suit so let’s dive right into our season preview!
For our new readers or anyone curious about the page. I am a data nerd and NFL fan so one day I became curious to see if I could use data and predictive modeling to accurately predict the outcome of games. This page is specifically not gambling advice, but I do personally bet on the NFL so gambling lines were a perfect fit to measure my model performance against. I wanted to start this project for a little while but the fear of putting my work out there for the world to see always stopped me as I worried about hypothetical criticism I was creating in my own head. But eventually I decided to go for it and took my first stab at developing the algorithm that would make picks. I like the idea of a predictive model being a window into the future like picturing a wizard pondering a mythical orb which is where the name comes from. This was happening during the 2022 playoffs, the year that the Rams went on to beat the Bengals in the Superbowl. Version 1.0 of the Orb model was a simple multi-linear regression model that I ran to predict the moneyline, spread, and over/under picks of every game. Surprisingly this worked great for the 2022 playoff run as the model hit at a profitable rate for each category in such a small sample size. Thinking I had figured out this whole crazy world of model-based NFL handicapping, I took my modest model into the following regular season. Oh boy did I learn my lesson, and quickly. Running one model for every single pick flipped the math against us and basically ensured that it would hit exactly 50% against the spread which I started to prioritize as the key metric to base its performance on. As I quickly learned more about the game that I was playing and how much the odds were stacked against the player, I knew I needed to adapt and change my strategy if we wanted any chance of creating value for our readers.
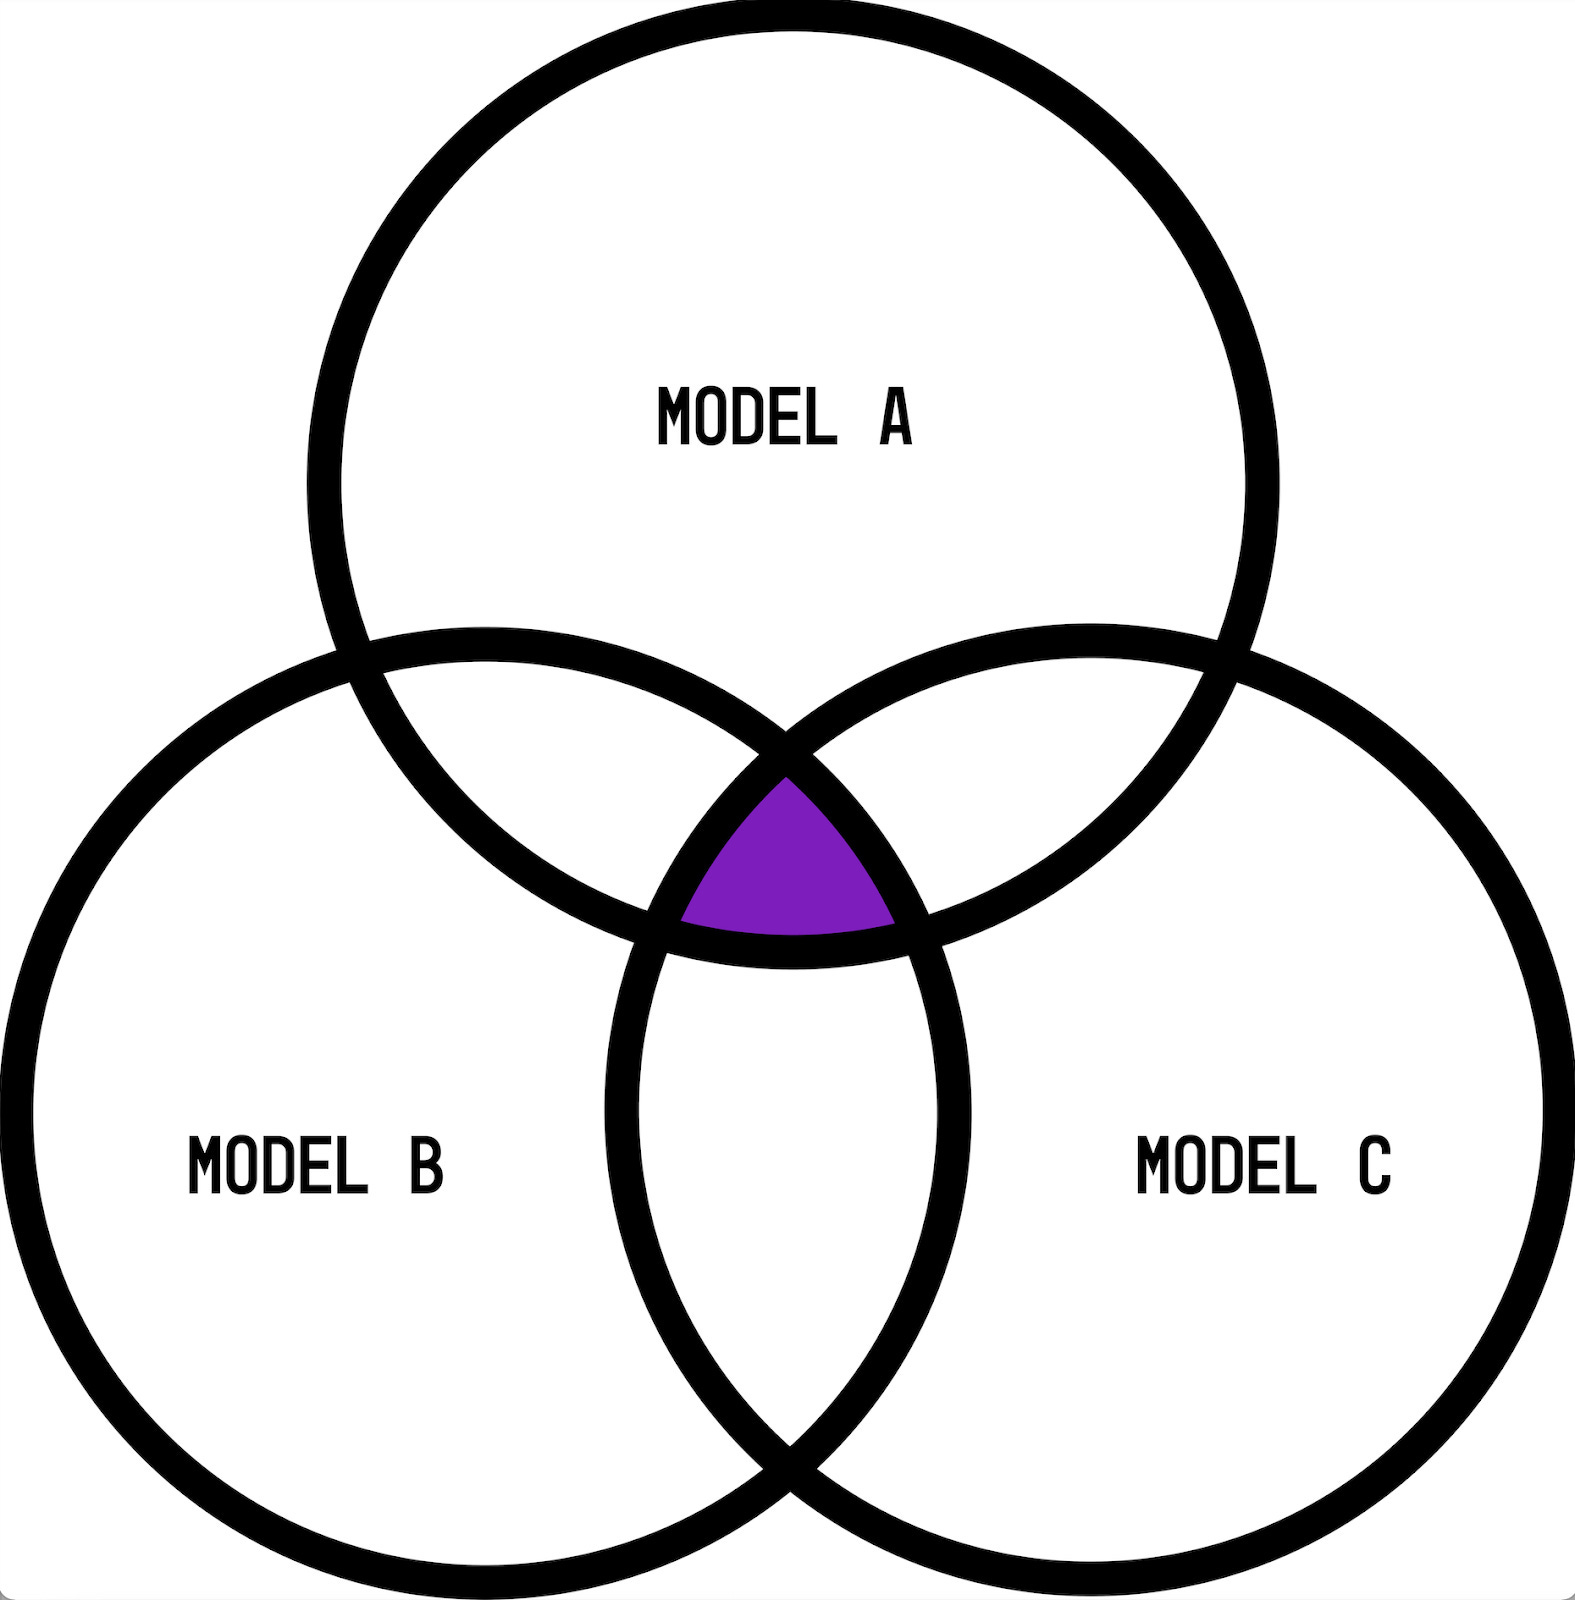
Last offseason I completely overhauled our modeling strategy. I scrapped version 1.0 of the Orb and replaced it with a multi-model approach that was built on predicting the binary outcome of whether a team covers the spread or not. So now we run three models and only give out picks when all three agree on the same outcome as illustrated below:
Through offseason testing, hard work, and of course good luck we saw an immediate payoff from this decision as the new Orb performed at a high and profitable level against the sportsbooks. For readers who aren’t familiar with gambling lines, a spread is the amount of points that the oddsmakers give to the underdog. Especially saying we think team X is 3 points better than team Y so if you want to bet on team X they will need to win by more than 3 points for you to win your bet. Their goal is to set the spread at the line that will give each team 50-50 odds to cover the points. Now if you won't be able to bet even money on this, as Vegas is not in the business of losing money. So while each spread pick theoretically has a 50% chance of hitting, they are offered at an average of -110 odds. This means you as a better risk $100 to win $90.91 from the sportsbooks. So if you were to win 50% of your spread bets, which is exactly what Vegas has rigged the game for us to do, you would slowly lose money. The difference in what you risk betting compared to what you stand to win ultimately equates to the profitability line being 52.4%. This means if you hit above this rate you will be profitable, and if you are below it on spread picks you are losing money. That is why this 52.4% is our magic number here at the Orb. All the work we do, and all of the data modeling is to try and be on the right side of this profitability line against the spread. I also run the models against moneyline picks each week to see who the Orb predicts will win the game outright. Because moneyline odds change from game to game, there isn’t one magic number to hit. So my goal for the moneyline picks last season was simply to be profitable. We were very thankful and lucky to hit both of these goals last season as our multi-model approach finished its first year +23.1 units. Here is the breakdown of the Orb’s performance last regular season:
Season spread picks: 60-42-7, 58.2%, +12.542 units
Season moneyline picks: 116-47, 71.2%, +10.562 units
So as we turn the page to the upcoming season do we guarantee the same results in year two of our new modeling strategy? Of course not! Our single biggest point of emphasis with this project is transparency and this comes in many forms. From the results of our weekly picks to our modeling strategy and performance goals each year. I love reading the work of other NFL fans and data nerds who give out picks but I do believe anyone who does has a responsibility to be open and transparent about the results of their picks. Some of the work you read online would make you believe that person has never missed a single pick and they can ‘guarantee’ you what is going to happen on Sunday. This never sat right with me and is something that Andy and I want to be a part of the change in this industry. No matter how much data you have, and no matter how complex your model is, as soon as they kick that ball off anything can happen. We wouldn’t watch if it always knew what was going to happen. But a garbage time touchdown or a freak play resulting in a pick-6 can be the difference between a pick hitting or missing. Sometimes the math can point to one outcome and then that team simply has a bad game that weekend. So while our goal is to use the power of analytics to navigate through the unpredictability of the NFL season, please understand that nothing in this game is a guarantee. The only thing I can promise is that the Orb will miss some picks. While we do everything we can to create profitable models, losing picks, losing weeks, and even losing seasons are mathematically unavoidable in this game, unfortunately.
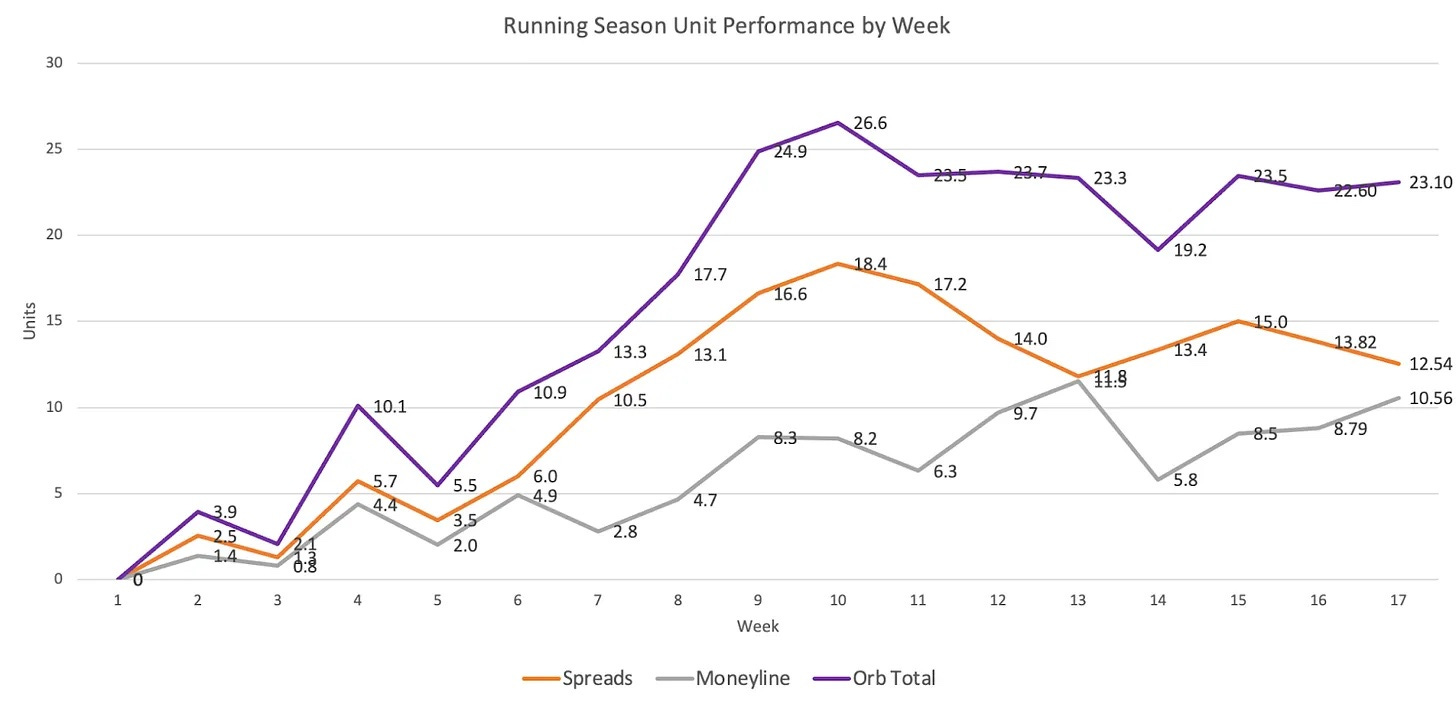
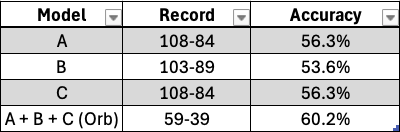
Since the models performed so well in their first season, there aren’t any drastic changes like we made last offseason. However, there are some smaller ones to point out and continue to give everyone a peak under the hood of the Orb. As you can see in the unit performance graph above, our spread model had an incredible first half of the season and then peaked in week 10. It was hitting 68% against the spread which while amazing, is not realistically sustainable. Between weeks 10-17, we saw a steady trend down, losing about 6 units. While the season as a whole was still a resounding success, trying to address this drop-off in performance was my biggest area of modeling focus this offseason. The first area of concern was model C. It was the only model of the three that didn’t hit above the profitability threshold on its own picking against eligible games last season. It ended the regular season with a 51.8% hit rate. At the end of last season, I alluded to the creation of a ‘golden metric’ that would be a simple single-metric model to replace model C. After offseason testing, I believe that our golden metric has the potential to be weighed in our modeling process but for now, serves better as a tool for determining the value of each model pick. So I did replace model C, but with a whole new predictive model rather than the golden metric. The new model type theoretically should combine better with models A and B in a way that could help avoid the mid-season dropoff and create more consistent results. My other theory on why this happened was that the models were overfitting on recent results later in the year. At the beginning of the season, team data is reactionary and changes significantly from week to week. The predictors for a team in week 2 will look very different than they do in week 3 since a single good or bad performance has more of an impact. By week 11, team data starts to cement more. A single high-scoring game at this point won’t raise that team’s averages by a significant amount. So my theory is that the models were putting too heavy a weight on the recent outcomes of similar predictors from last week’s results. Long story short, later in the season I am going to start using a 2-week lag of our training data so the models won’t be trained on, and then over-index, results from the previous 2 weeks. I tested out various lag times and the 2-week lag consistently performed the best. Using the new model C and a 2-week lag period I was able to run the models against last season to see how they ‘would have’ performed. As always, testing against historical data creates a safe environment compared to turning a model live so always take historical testing with a grain of salt:
Testing the Orb against last season with the new model C resulted in the picks between weeks 11-17 hitting at 54.8%. This translates to a +1.9 unit performance down the stretch rather than the -6 unit performance we saw in real-time.
In version 1.0 of the Orb, I tried implementing a model value for each pick in a stoplight format so each pick was either high, medium, or low value. Using the linear regression model that predicted the actual score of the game, it was easy to derive confidence by comparing the difference in the Orb’s predicted score to the actual spread of the game. Like many lessons with Orb 1.0, I quickly learned that I was oversimplifying a complex problem and it didn’t work as picks hit at about the same rate regardless of what value segment they were in. But this idea of assigning a value to each pick and having it work - meaning high-value picks hit at a higher rate than medium and so on - has stuck with me and turned into a white whale for this project. If we are able to successfully create this, it will give us really exciting options moving forward. If the lowest value picks are hitting below 52.4% and actually hurting the Orb’s overall performance we can drop them from the model. If high-value picks are hitting at a rate significantly higher than the others, that would be valuable information for the readers to know. So this offseason I worked on using our golden metric to calculate the model value for picks. One change that I will be making is around the language. Rather than the lowest value being ‘low’ I will be calling it ‘standard’ as each standard pick still has the confidence of three models backing it. This season we will be testing this live for our paid subscribers, meaning you will see the value of each pick heading into the weekend. Like the model testing above, the results here were tested against last season. My hope is that we are able to replicate something close to this live throughout the year, but here is how the value breakdown of the picks made above looks:
Considering the overall hit rate in testing was 60.2% I am not surprised that there is not a significant difference between the accuracy of Medium and Standard. In an ideal world, we would see cascading hit rates from the top down. So it will be interesting to track this throughout the year as we test it live.
A few quick thoughts on the moneyline model before we get into some season goals and bigger-picture items. I put less emphasis on the moneyline performance than I do spreads, but I still believe there is value in doing it. Not only did it finish +10.5 units last season, but the underlying numbers are interesting. The biggest complaint I could see people having with it is that it's boring. The model picks the favorite to win at -money quite a lot. It did so about 90% of the time last season. The reason for this is that the favorites win most of the time. Last season the favored team won the game roughly 68% of the time. So each model predicts an outcome that happens more than 2/3 times. It is rare that all three models will agree the same game will be the outlier. But what this does do is help eliminate games where even one model isn’t confident in the favorite. If you blindly picked a favorite to win last season you would have been right more often than not. So why do you need a model to tell you it thinks the favorite will win? When the Orb predicted the favorite to win, it hit at roughly 75% meaning that blindly picking an Orb favorite increased your odds of being right by 7%. On the flip side, if you wanted to go against the grain and randomly pick the underdog to win outright, you would have been right 32% of the time. When the Orb predicted the underdog upset, it was right 46% of the time increasing your odds of a +money upset by 14%. So while giving out favorite moneyline picks isn’t as exciting or fun, last season we saw the models do their job and tilt the odds more in our favor. While I would love for the moneyline model to be more exciting and predict every upset that is about to happen, as long as it is profitable I am ok with boring.
While replicating last season’s 58.2% hit rate against the spread would be amazing, we will not be using it as a benchmark this year. In the data world, past performance is not a promise of future results. However, I do believe in setting measurable goals and want to add a few layers of specificity for the 2024 season. That way after week 18 we can come right back here and see how we measured up.
Regular season spread goals:
Hit above 52.4%
This is our single biggest goal each year. If the Orb hits this and misses the rest I will still consider it a successful season
Hit above 52.4% when predicting both the favorite and the underdog to cover
Last season we would have hit this as the Orb hit 63.2% of the time when predicting the favorite to cover and 53.6% when predicting the underdog
Have ‘high’ value picks hit at a higher rate
If we are able to replicate anything close to the results of the value picks against last season we will be set for some exciting options moving forward
Have at least one model hit above 52.4% on its own for the whole season
Last season, models A and B achieved this. This will not include games that I manually remove (example: when a franchise quarterback is out injured).
Regular season moneyline goals:
Be profitable
Same goal as last year.
Hit over 50% when predicting the underdog to win outright
Since the models give out the favorite to win outright significantly more, I want to measure how the models perform when giving out an underdog moneyline. Since they will be +money, hitting at or above 50% would mean the Orb's underdog moneyline picks are profitable
Hit at a higher rate than blindly picking every favorite to win.
We also would have hit this goal last year as favorites won 69.1% of games, while the Orb’s moneyline model hit 71.2%.
None of the numbers above, or work that supports them, would be possible or worth it without your support. Even cooler and more rewarding than having a winning record last season was seeing the growth and support of the page. The feedback Andy and I have received has been overwhelmingly positive and truly makes the Orb project worthwhile. So whether this is the first time you are reading our work, or you have been subscribed since the early days of the Orb 1.0 model, thank you so much for being a part of the growing community here. If you enjoy our work and want to continue supporting the Orb further, there are easy ways to do so that go a long way in helping us achieve our goals for this page:
Subscribe to the page as a free member
Like or comment your favorite picks throughout the season
Share the page with friends who might also enjoy our work
Think about upgrading to a paid member for additional picks and content
Simply reading the page means a lot to us and one of our big goals is to continue to create significant value for our free subscription readers. We have no plans of throwing this whole page behind a paywall and excluding so many of our amazing readers from seeing the Orb and many of its picks. But a lot of time and effort goes into running this project so each and every paid subscription makes a big difference. On that note, we will be raising the paid subscription prices this season. However, if you are already a paid subscriber this will not impact you as you will be grandfathered in at the price you are currently paying. This is part of a thank you for supporting us early. If for whatever reason you see your price increase, please let us know and we will remedy it as quickly as possible. The prices this season for a paid subscription will be $25 per month or $100 for the year. But if you are currently a free subscriber and want access to the additional paid content at last year’s prices, we will be keeping the current $45 yearly plan open through week 1 before increasing it to $100. With increased prices, we also want to increase the value of a paid subscription. So this NFL season the subscription will include:
Model picks for any non-Sunday games
If there isn’t a consensus pick on these games you will see what each individual model predicts
Snapshot Analysis to help form your own opinions and predictions
Preview can be found here
Model value for each pick
So just to clarify, although free subscribers won’t see the picks for non-Sunday games, you will always see the results of the picks and their impact on the season performance.
Andy and I couldn’t be more excited for the upcoming NFL season and once again want to thank you for spending part of it with the Orb! Let’s have an amazing season and after 18 short weeks, we will check back in on our season goals and hopefully see green check marks next to many of them. Football is back!
Presenting Sponsor

Fantasy Football season is coming up which means one thing: the draft is coming. What if there was a way to play fantasy football where every week was as exciting as draft week? And we don’t mean daily fantasy, this is a brand new way to play with all your friends in one league for a full season. KART Fantasy Sports has completely remade Fantasy Football focusing on what players love about the game. We’ve added brand new mechanics that make trading easier and more like real-world sports trades, roster mechanics that make you have to make real decisions every single week, and systems to make sure everyone stays competitive all season. No more players dropping out mid-season! If you love fantasy football but have always wanted more, you have to try KART Fantasy Sports this year!
If you want to try out the best way to play fantasy football this season, email kartfantasysports@gmail.com or use the sign-up link here today!
-Team Orb Analytics Limited
.
.
.
.
.
.
DISCLAIMER:
The information provided on this website is for informational purposes only. It is not intended to be gambling or financial advice, and should not be relied upon as such. We are not responsible for any actions or decisions taken by readers based on the information provided on this website.
The picks and predictions provided on this website are based on our own research and analysis and are intended to be used for entertainment and informational purposes only. We do not guarantee the accuracy or completeness of the information provided, and we are not responsible for any losses or damages incurred as a result of using this information for gambling or other purposes.
By accessing and using this website, you acknowledge and agree to the terms of this disclaimer, and you assume all risks and liabilities associated with your use of the information provided on this website.
Pumped for all the new features this year and to follow another season long journey with the Orb!
Hi, I'm from Poland in europe and I don't know if I understand correctly. A spread of e.g. Packers +3 means that Packers wins and scores 3 more points? And Packers -5,5 means that Packers wins but not more than 5,5 points i.e. for example 21-16 ?
Correct me if I am wrong. Thanks for what you do, data science in sports and medicine are the greatest fields of the 21st century.