


Week 13 Newsletter and Picks


Week 12 was simultaneously a disaster and a miracle for the Orb. As far as I am concerned personally, it was our worst week of the season. But the data will technically say it was a slight win on the season unit record. This is a great example of how data can lie and not tell the whole story. Our spread performance this week - the one we care about more internally - was horrible. Our models dug us in what felt like an insurmountable hole on thanksgiving as they went 0-3 against the spread. The only favorite they took to cover were the Lions, who of course ended up losing outright and starting the week off on the wrong foot. The rest of the games went chalk as 12/16 favorites covered and 13/16 won outright. The public got a big win over Vegas this week while it left the Orb in shambles as we predicted many underdogs to cover. Where things did go our way was on the moneyline picks. We’ve had weeks in the past where a big +unit performance against the spread covered up for -unit picks on moneyline, so we were owed one. Our moneyline models heavily leaned on favorites which thankfully went our way and technically canceled out the spread performance in terms of overly units won/lost. But don’t think that we are moving the goalposts or letting ourselves off easy here. What will look like a ‘no-blood’ week in the record books was nothing short of a catastrophe. Again, in the scope of this project is is interesting to see one Here is how each pick performed from week 12:
Spreads:
Lions -7.5 ❌
Seahawks +7 ❌
Jets +9.5 ❌
Panthers +3.5 ❌
Cardinals +2.5 ❌
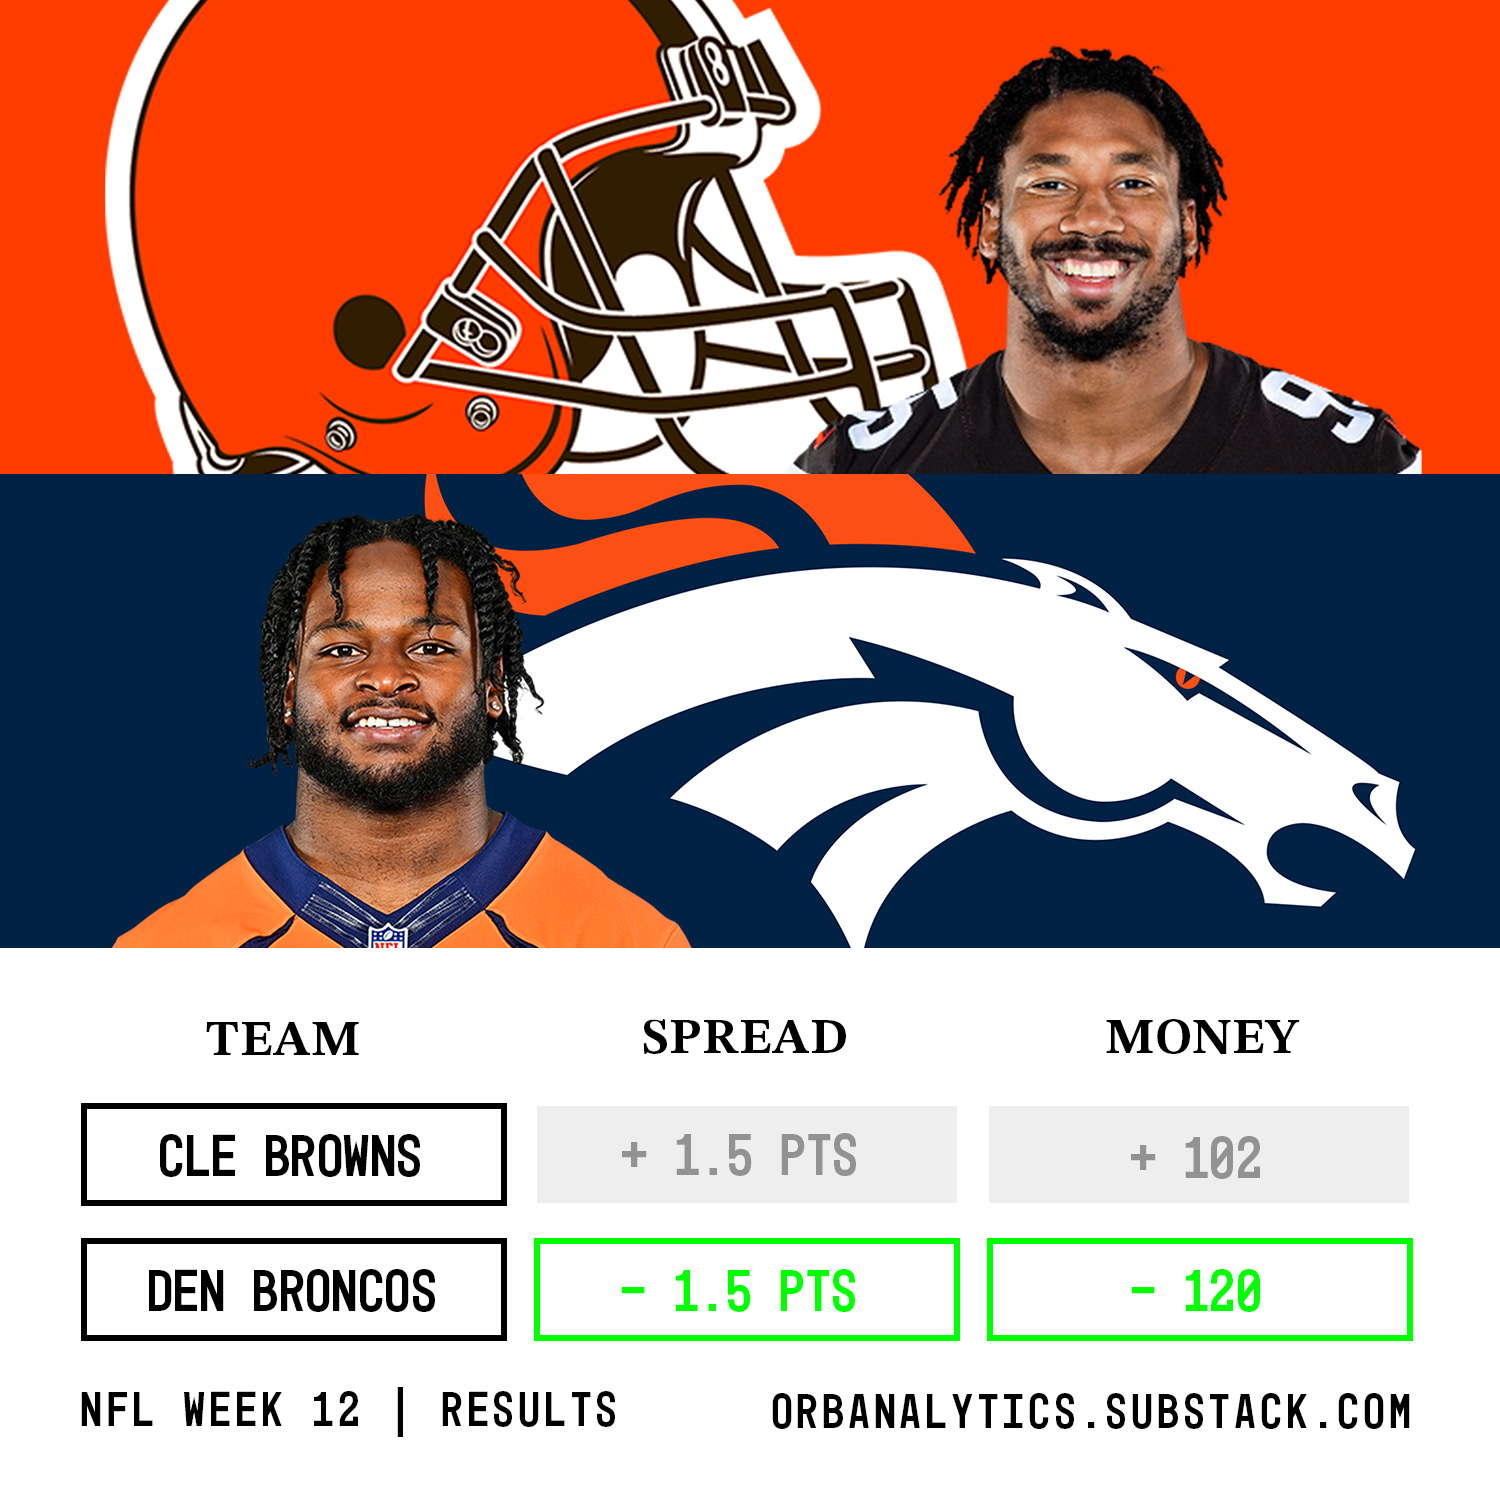
Broncos -1.5 ✅
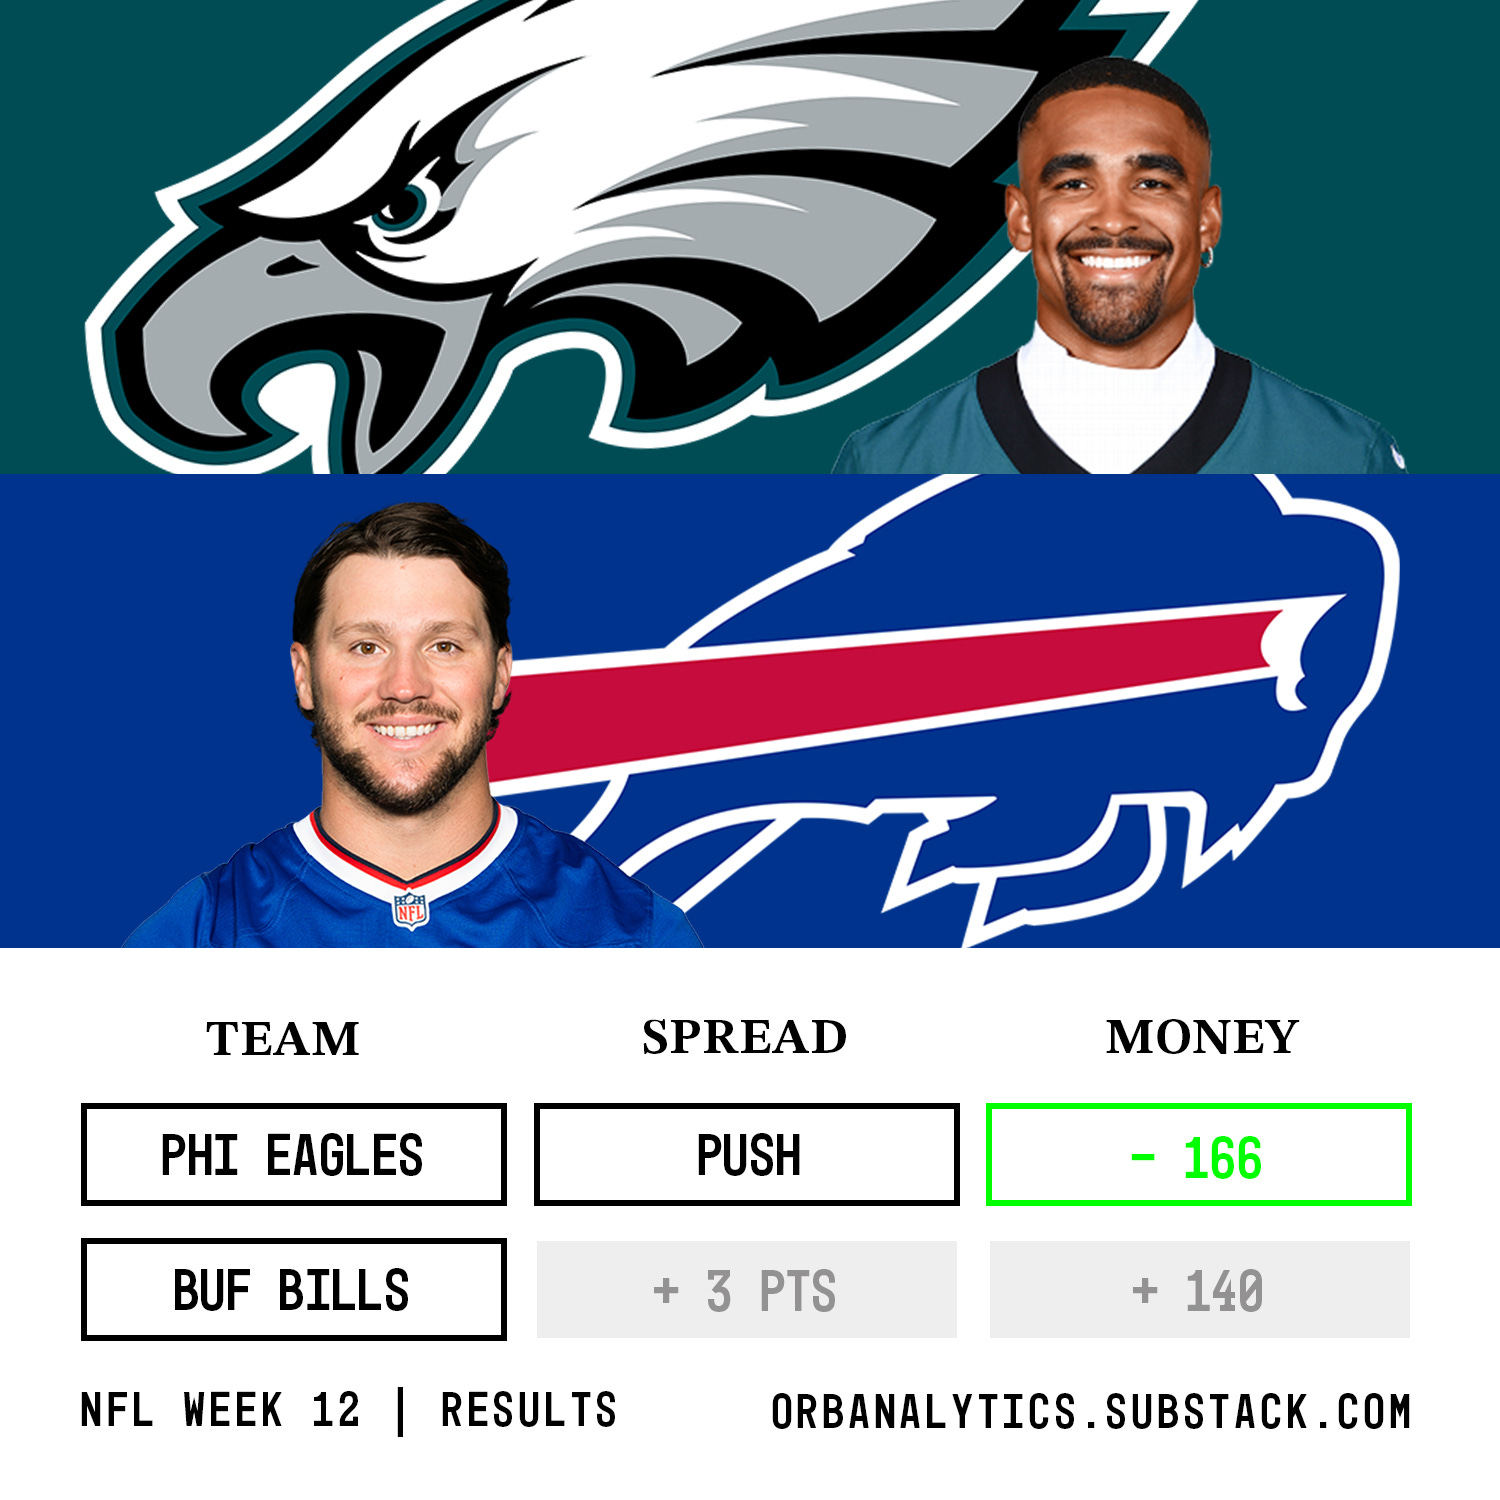
Eagles -3 🟨
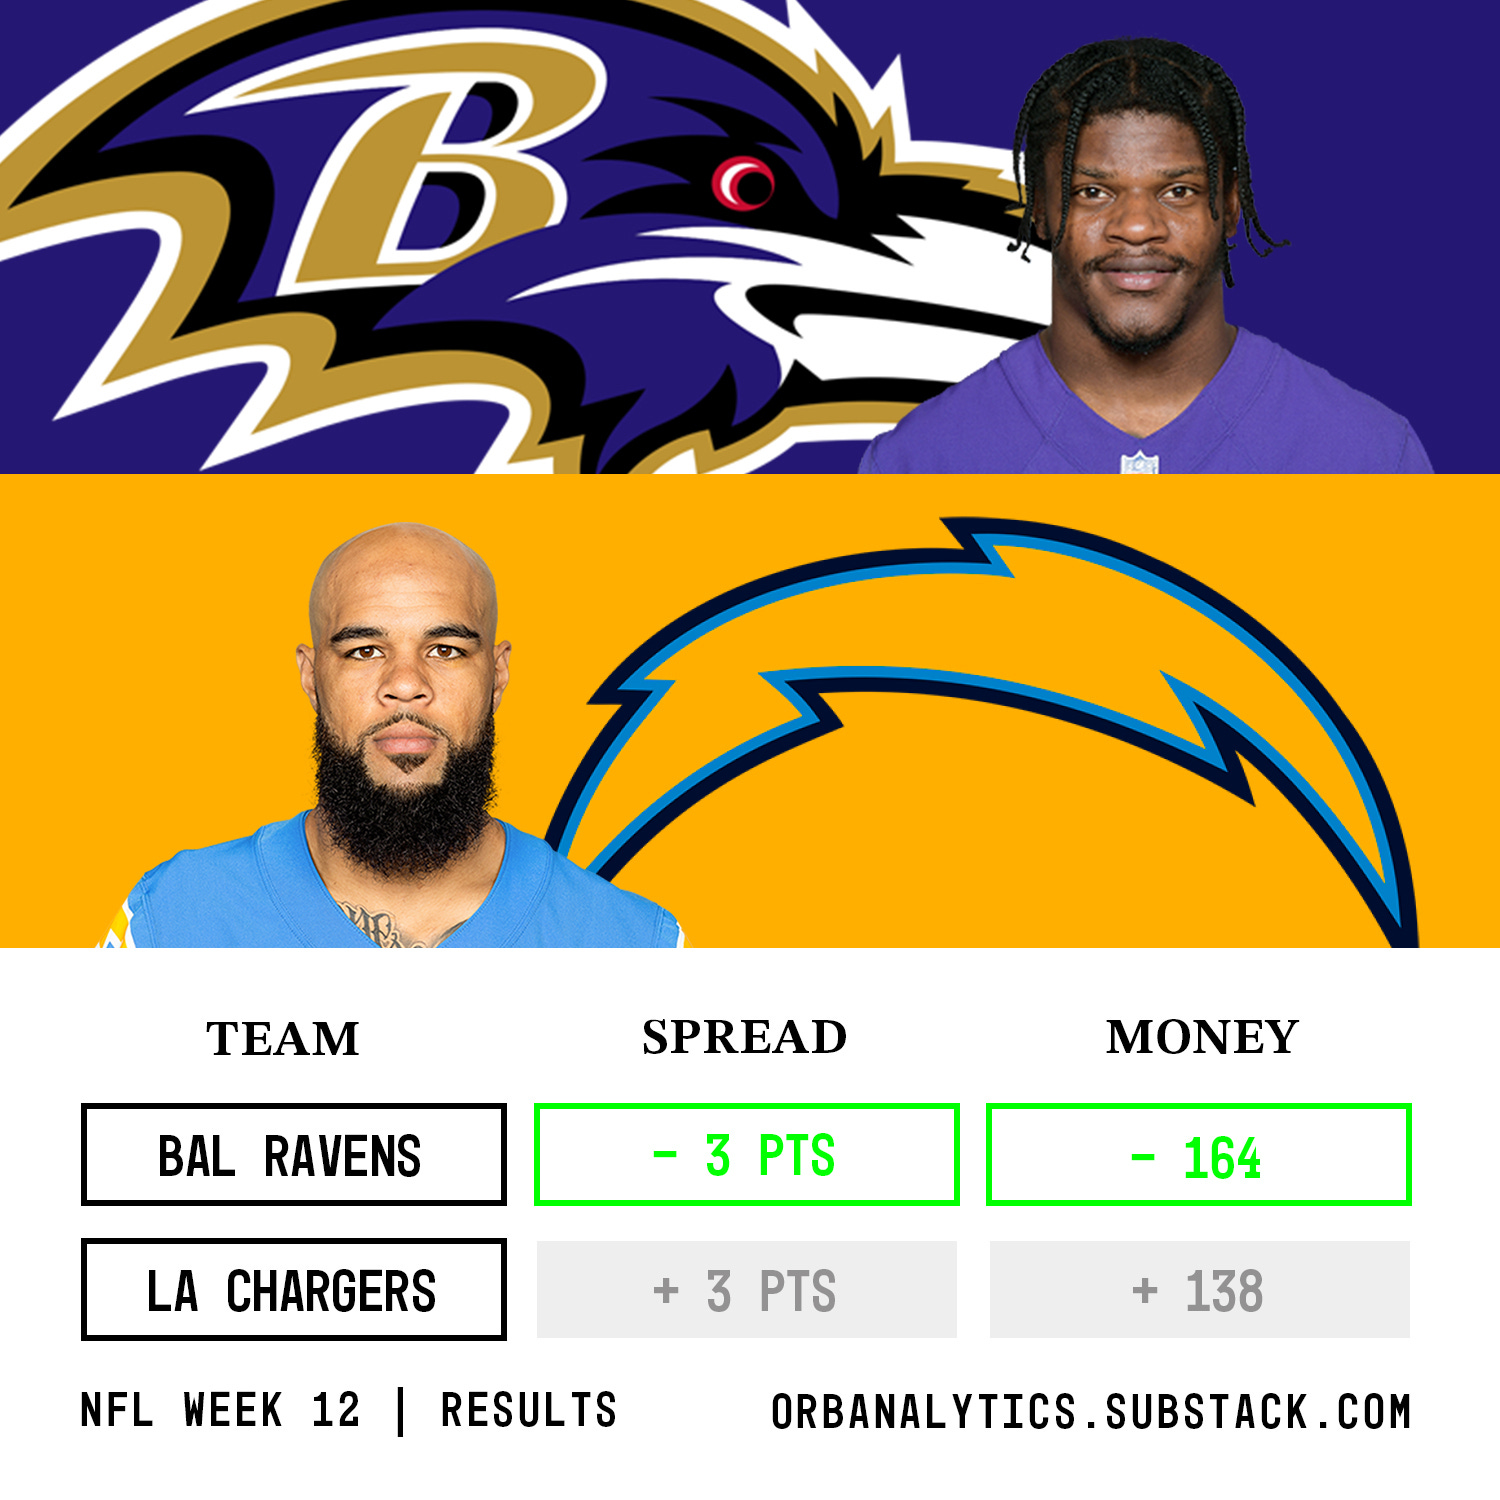
Ravens -3 ✅
All spreads: 2-5-1, 31.3%, -3.182 units
Moneyline:
Lions ❌
Cowboys ✅
49ers ✅
Dolphins ✅
Jaguars ✅
Falcons ✅
Colts ✅
Broncos ✅
Chiefs ✅
Eagles ✅
Ravens ✅
Vikings ❌
All moneyline: 10-2, 83.3%, +3.374 units
This technically results in a +0.192 unit performance in week 12, although we all know that doesn't tell the real story. That takes a good chunk out of our spread pick winnings this season but does add a healthy amount to our moneyline total. This is now the closest and most balanced our modes have been in terms of unit winnings since week 6. Here is how week 12 impacted our season totals:
Season-to-date results:
Season spread picks: 44-26-4, 62.2%, +13.998 units
Season moneyline picks: 83-32, 72.1%, +9.69 units


I’m sure it comes across in my writing, and maybe in this week’s newsletter in particular, but I am pretty tough on myself and the models. I tend to focus on the fewer -unit weeks far more than I do the +unit ones. This week especially got me down about this project and the season as a whole. If I take a step back and look at the season-to-date performance, there is so much to be excited and proud about. Going into the season, if you told me the Orb would be hitting above 60% against the spread and up 23.6 units going into week 13 I would be thrilled. I wish it could hit at 62% every week and be consistent rather than go through volatility but of course that isn’t possible in this game.
On the other hand, maybe we’ve accidentally created a fade-machine. Our models took the Cowboys to win and cover Thursday night, which puts us in another hole, albeit much smaller than last week. Not a great sign when our ‘get-right’ week starts out 0-1. Here is what our models predict will happen in week 13:
Spreads:
Cowboys -8.5 (TNF) ❌
Saints +4.5
Titans +1.5
Commanders +9.5
49ers -3
Packers +6
Moneyline:
Cowboys (TNF) ✅
Chargers
Steelers
Texans
Lions
Falcons
Dolphins
Buccaneers
49ers
We hope to stop the bleeding on Sunday and get back on track. Considering where our overall record still stands, I haven’t looked to change anything in our code our modeling strategy but if we have a third losing week against the spread, I may have to do a little in-season tinkering around. As always, thank you for reading and sharing the Orb, we hope to have better results to share with you again soon!
- Team Orb Analytics
.
.
.
.
.
.
DISCLAIMER:
The information provided on this website is for informational purposes only. It is not intended to be gambling or financial advice, and should not be relied upon as such. We are not responsible for any actions or decisions taken by readers based on the information provided on this website.
The picks and predictions provided on this website are based on our own research and analysis and are intended to be used for entertainment and informational purposes only. We do not guarantee the accuracy or completeness of the information provided, and we are not responsible for any losses or damages incurred as a result of using this information for gambling or other purposes.
By accessing and using this website, you acknowledge and agree to the terms of this disclaimer, and you assume all risks and liabilities associated with your use of the information provided on this website.
Why are the 49ers in the spread but not moneyline?
That graph is still lookin pretty dang good for 13 weeks into the season. There will be natural ebbs and flows to just about any type of performance. My two cents is to let this version of the model ride out for the duration of the season and playoffs. After that, look back and see where there were any big misses and see what those teams/games had in common. Any metrics that carried too much weight? Any metrics that were potentially missing, but important? Was there contextual information that didn't get accounted for (new coach, weather, etc).