


Regular Season Recap and Wild Card Weekend Picks


Eighteen weeks later, the regular season is over and it's time for the playoffs. We have a full breakdown of how the Orb performed this season for you, I won’t waste too much of your time with a long intro. Overall I think we did a good job in terms of consistency of our blogs. Every week we had Thursday picks for our premium readers, the Sunday newsletter, premium Monday picks and additional Andy Diamonds content. Weeks 2-16 we were able to get them out on a regular schedule with the newsletter coming almost every Friday. The last two weeks have been an example of life happening. The week 17 newsletter was out later than usual because I was on vacation and I was too sick last week to collect the data and run our models for week 18. Thank you for you patience and understanding, we hope to stay as consistent as possible but we know that sometimes it just isn’t possible.
I owe you a recap of the Orb’s performance in week 17, so here is how each pick went:
Spreads:
Browns -7.5 (TNF) ✅
Cowboys -4.5 ❌
Ravens -3.5 ✅
Titans +4.5 ❌
Giants +4.5 ✅
Commanders +12.5 ❌
Eagles -11.5 ❌
All spreads: 3-4, 42.8%, -1.273 units
Moneyline:
Browns (TNF) ✅
Cowboys ✅
Ravens ✅
Bills ✅
Texans ✅
Rams ✅
Eagles ❌
Chiefs ✅
All moneyline: 7-1, 87.5%, +1.773
And then quickly just for my own amusement, since I wasn’t able to get the models running last week I just took a look at my fever state at each game and made a spread prediction. Here's how my fever brain performed:
Ravens +3 ❌
Texans -1.5 ✅
Saints -3 ✅
Browns +7.5 ❌
Titans +3.5 ✅
Buccaneers -4.5 ✅
Jets +1.5 (please lose this game @patriots) ✅
Lions -3.5 ✅
Bears +3 ❌
Commanders +13.5 ❌
Cardinals +3 ✅
Rams +4 ✅
Raiders -3 ✅
Chiefs +3.5 ✅
Bills -2.5 ✅
11-4, 73%, +5.99 units
In a week that featured starting quarterbacks like Blaine Gabbert, Jeff Driskel and Tyler Huntley, maybe not even trying to use data was the right call all along. The new plan for next season is that we are going to scrap the predictive models and I am just going to get the flu every week. But we have a lot of numbers to get to from this season, so let’s dive right in.
What were our goals heading into the season:
Andy and I talked a lot heading into this year to recap what we learned from last season, to set goals for the upcoming season, and strategize on what we can do to try and achieve those goals. As the data side of the Orb, my goals were focused on model performance, while Andy focused on our design and growing our reader community and overall Orb brand. I’ve talked about it throughout the year, but the main goal of the Orb project for me is to see if we can build a predictive model that is profitable against Las Vegas. This means hitting above a 52.4% rate against the spread. We are trying to play a rigged game where the house always wins. Vegas’ goal is to make every spread pick have 50-50 odds while offering an average of -110 odds on each pick. This means you would need to bet $110 to win $100 on each 50% probability pick. This is why the profitability threshold is 52.4% and not 50.1%. It may seem like a small difference, but over time in this game every 0.1 percentage point counts. While my target goal was 52.4%, I wanted to challenge ourselves and I set what I thought was a lofty internal goal of 53.5%. I admittedly put more time and emphasis on our spread picks, but for our moneyline picks, I set a goal of simply being profitable. Because each game has unique odds, the winning rate does not have a one-to-one correlation to unit performance. My main strategy to achieve this was moving off of a singular linear regression model, in favor of a multiple logistic model one. My main thought was that we only care if a team covers/wins, not by how much. The other important goal that this would help achieve is limiting the number of picks that we give out. As you increase your sample size of picks with a 50% likelihood of hitting, the laws of probability will drag your hit rate down to 50%. Giving out picks only when all three of our models agreed would theoretically help us achieve a higher hit rate, as each pick would have the confidence of all the models. On the other side of the Orb, Andy’s main quantifiable goal was to increase the subscriber count of our Substack while also growing us on social media. We went into this season with 60 subscribers and Andy challenged us to get to 200 heading into the playoffs. This would be a 333.3% increase from where we started heading into week 1.
So how did we perform against our goals? Let’s find out!
What happened this regular season:
Before we break down how our models performed over the regular season, let’s quickly recap what actually happened on the field. When I was sick last week I left our week 17 excel file open and it got corrupted before I was able to save it properly. What this means is that the below numbers have every game from weeks 2-16 as well as the games that the Orb make a spread pick for in week 17, but not the rest of the week 17 games.
In the 230 games we collected data for between weeks 2 and 17, favorites got the edge on underdogs as they went 120-99-11 against the spread. This means if you take away the pushes, favorites covered in 54.8% of games. They won 159/230 games outright, for a winning percentage of 69.1%. One benchmarking test I have for our models is seeing if they outperform a strategy of blindly taking one side with every pick. Meaning in order to have outperformed blindly taking every favorite to win and cover this season, our modes had to hit at a rate higher than 54.8% against the spread and above 69.1% on moneyline picks. As you’ll see in our record below, I am happy to announce that the Orb outperformed the ‘all in’ picking strategy.
How did our models perform this regular season:
Season spread picks: 60-42-7, 58.2%, +12.542 units
Season moneyline picks: 116-47, 71.2%, +10.562 units

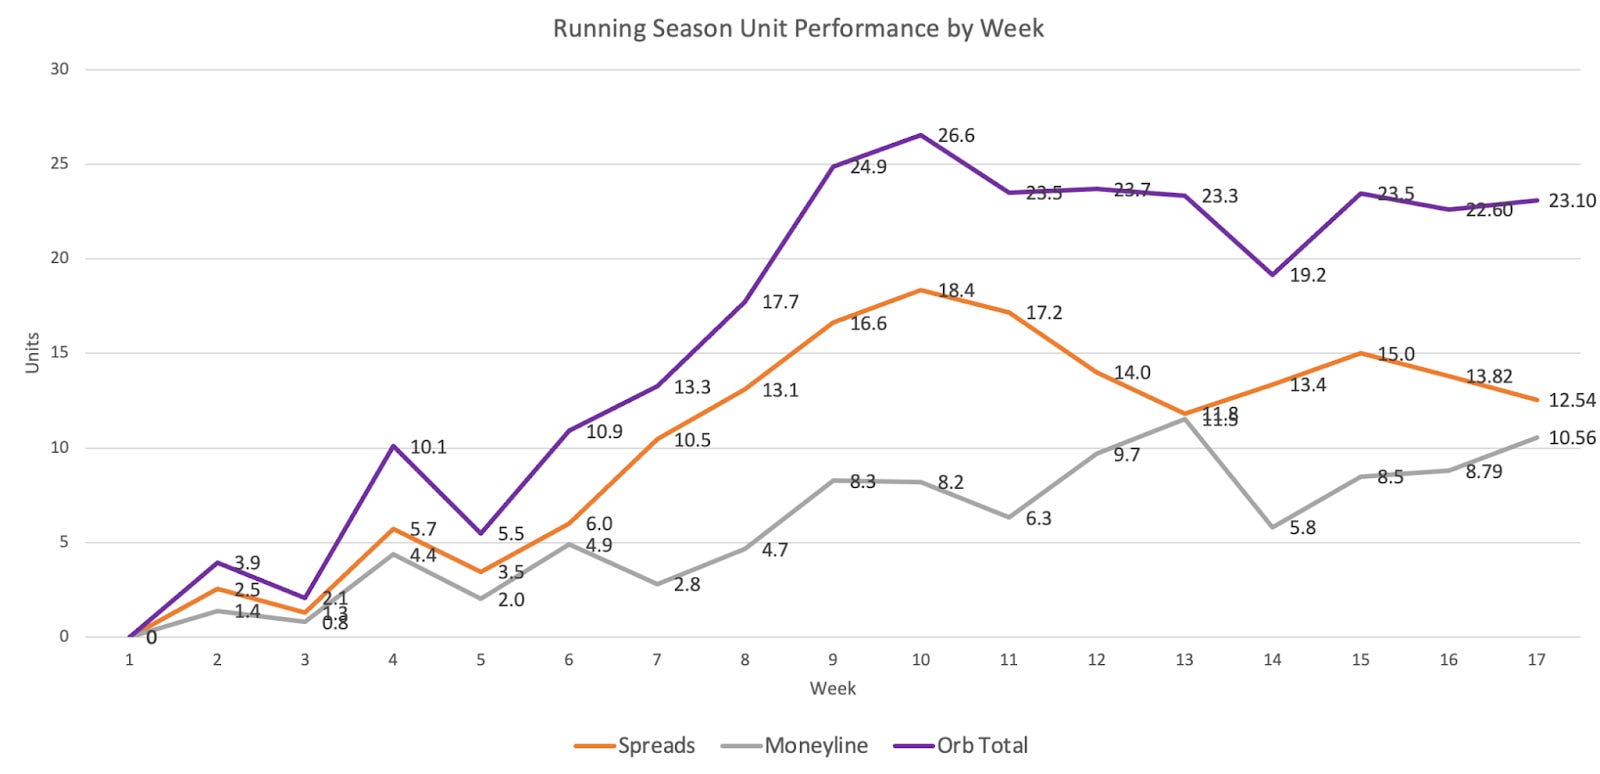
The overall takeaway from the graphs above is that the Orb hit our performance targets this season! It may be just a one-year sample size, but we can confidently say this regular season was a success. Our models hit 58.2% against the spread, 6% above our main goal, and 4.7% above my lofty secondary target. The Orb finished +12.54 units on spread picks and +10.56 units on moneylines. This translates to an average return on investment of +1.44 units per week. It’s interesting that these two finished so close to one another, but I am thrilled that both types of picks finished double-digit units in the green. The less positive takeaway from our season performance is that our models peaked around week 10. The Orb was sitting at an unsustainable 68% hit rate against the spread so in some ways, it was a disappointing finish to the season as it dropped 10 percentage points from its all-time high. I have a lot of data to explore this offseason to try and figure out why this happened and how we can potentially avoid it in the future. But again, we are trying to use predictive analytics to beat a rigged system and for this regular season, I’m proud to say that the decisions we made in the offseason paid off.
Next, I wanted to take a look at how the Orb performed when picking favorites vs underdogs to cover. Que the confusion matrix:
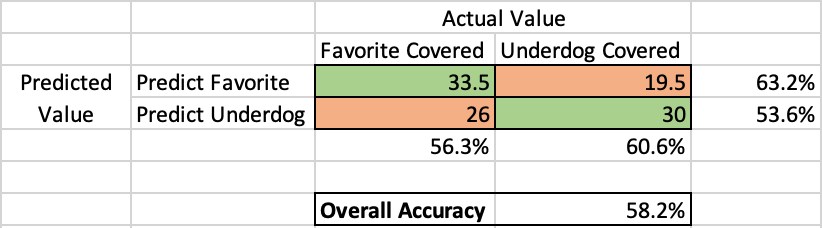
Our models performed better when picking favorites, as they hit on 63.2% of these picks. This is compared to their 52.6% hit rate on underdog picks. The most probable reason for this as we saw in the ‘what happened this season’ section above is that favorites simply covered more often. I have mentioned before, but there are instances where I will manually hard-code out picks. In order for this to happen, the team on the field needs to not be representative of the data they have put up this season. Most often this is when a team loses their franchise quarterback due to injury, or simply they are named the Carolina Panthers. This season there were 31 games that our models made a pick on but I removed them as the data did not reflect what we would see on the field. The Orb would have gone 12-19 against the spread in these games, or 38.7% and -8.092 units. The analytics term for seeing a decision pay off like this is ‘really cool.’
Now let’s break down how each model performed individually and each combination of models. These numbers do not include the 31 games that were manually removed and not given out:

The model comparisons are one of the more interesting things to me. I am always curious about what combination of models will perform best and why. Individually, models A and B each hit above the 52.4% target while model C would not have been profitable on its own. Any combination of the two models would have been a successful season, but it is fascinating to see how much the performance increases when we combine all three. I wonder what the relationship between the number of models and the hit rate is. It would be great if it was perfectly linear and more models always meant better performance. This is something I am going to spend some time this offseason looking into further.
Finally, let’s see how our growth goal of hitting 200 readers going into the playoff did. Here is a graph showing the number of recipients of each week’s newsletter:

Not only did we hit our goal in week 9, but we more than doubled our target by the end of the season. The two people who are solely responsible for this are Andy Diamonds and you. Andy has put in so much work marketing us on social media and word of mouth. You, simply by hitting that ‘subscribe’ button have made this year worth it, so thank you.
Wild Card Weekend:
Now it’s time to look forward and keep our momentum going into the playoffs. I’m curious to see after a few seasons if playoff games need to be modeled differently so for now I am going to keep our playoff performance separate from the regular season. Normally I give out all the picks for games on Sunday here in the Newsletter. But due to which games the Orb made picks for this weekend this would have left you with only one spread pick in Sunday’s slate. Instead we are shuffling this around. Here will be the spread and moneyline picks for both of Saturday's games as well as all the moneyline picks on Sunday for games that the Orb did not make a spread prediction in. The premium picks will be the spread/moneyline picks from the Lions-Rams game Sunday night as well as the usual Monday game picks. I’ll probably have to do some form of this for each playoff round so that we get enough picks in the Newsletter while also keeping our favorite readers happy. Here is what the Orb predict will happen this weekend:
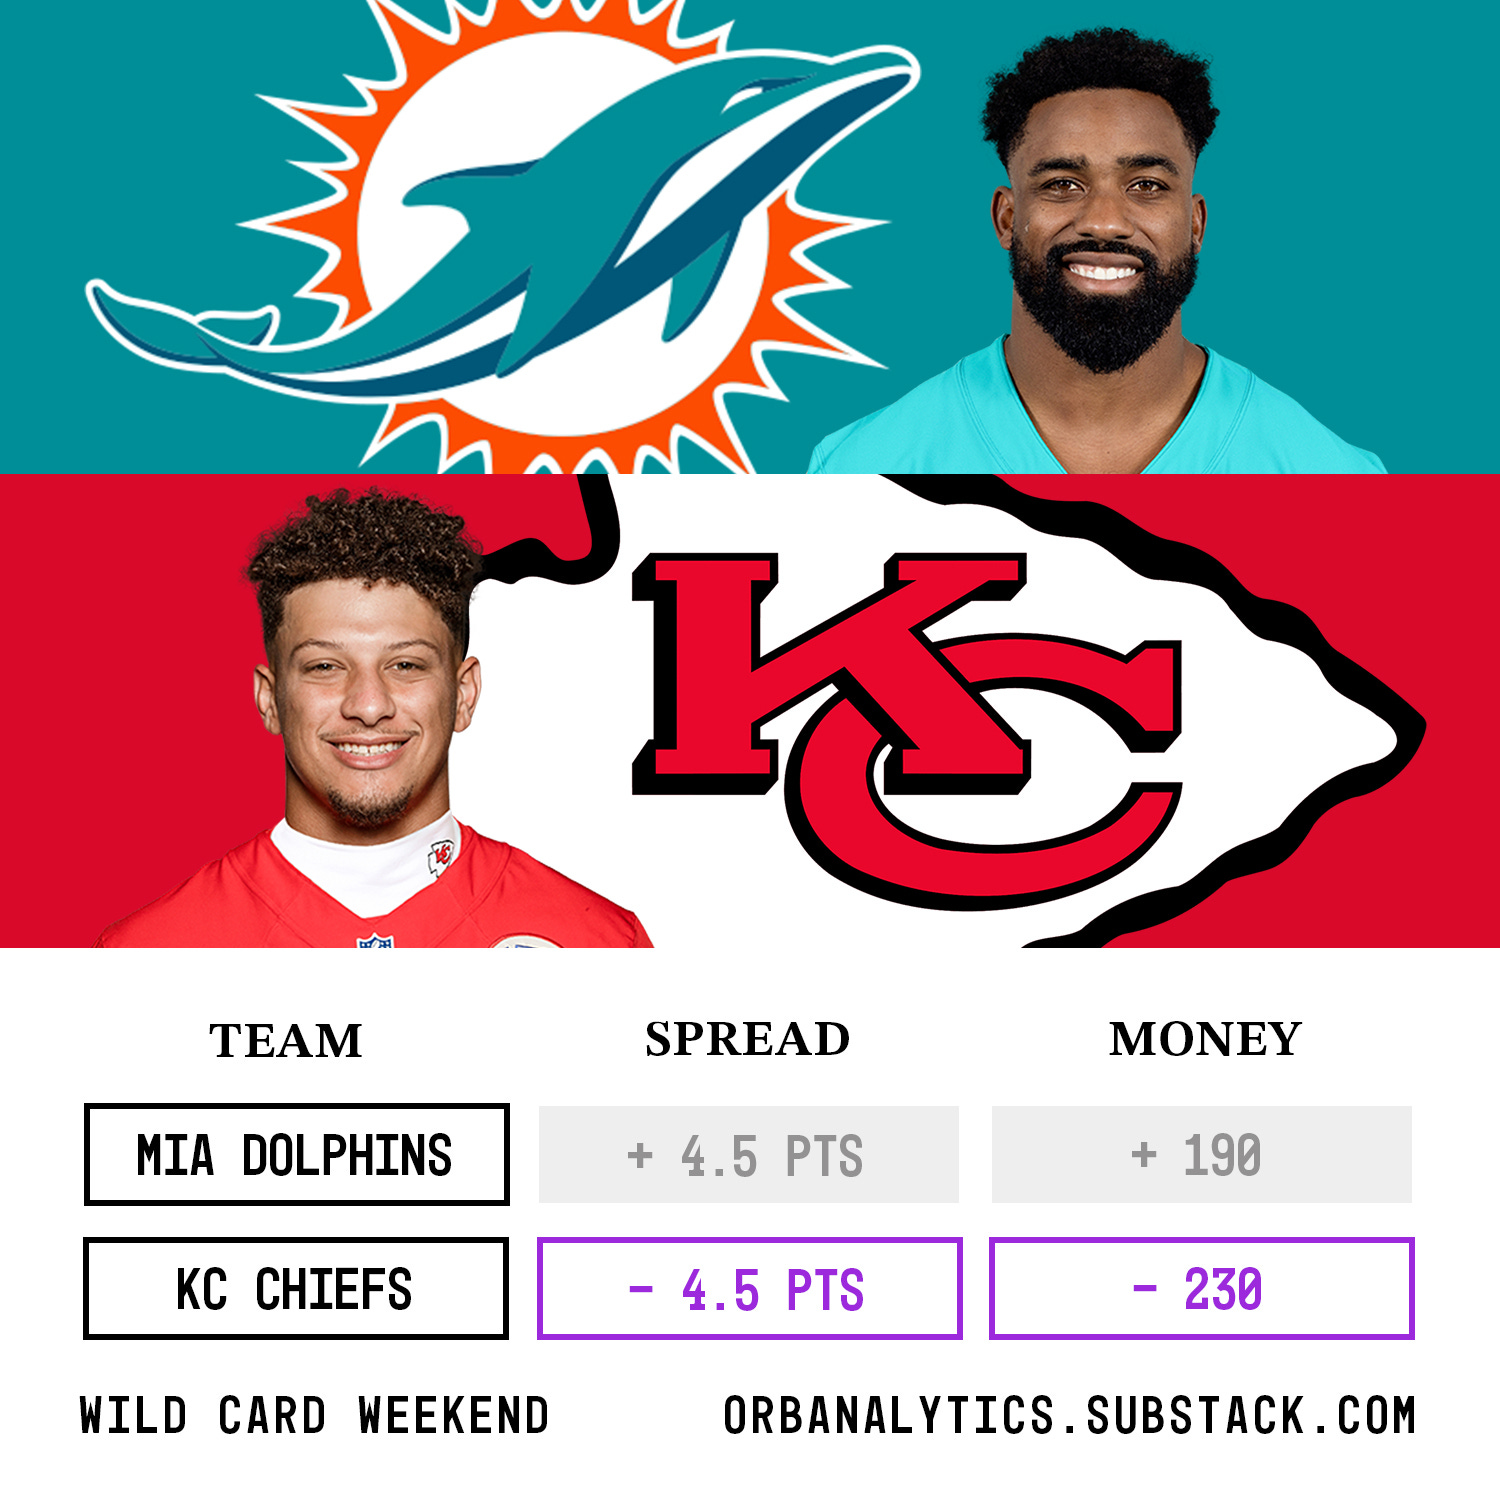
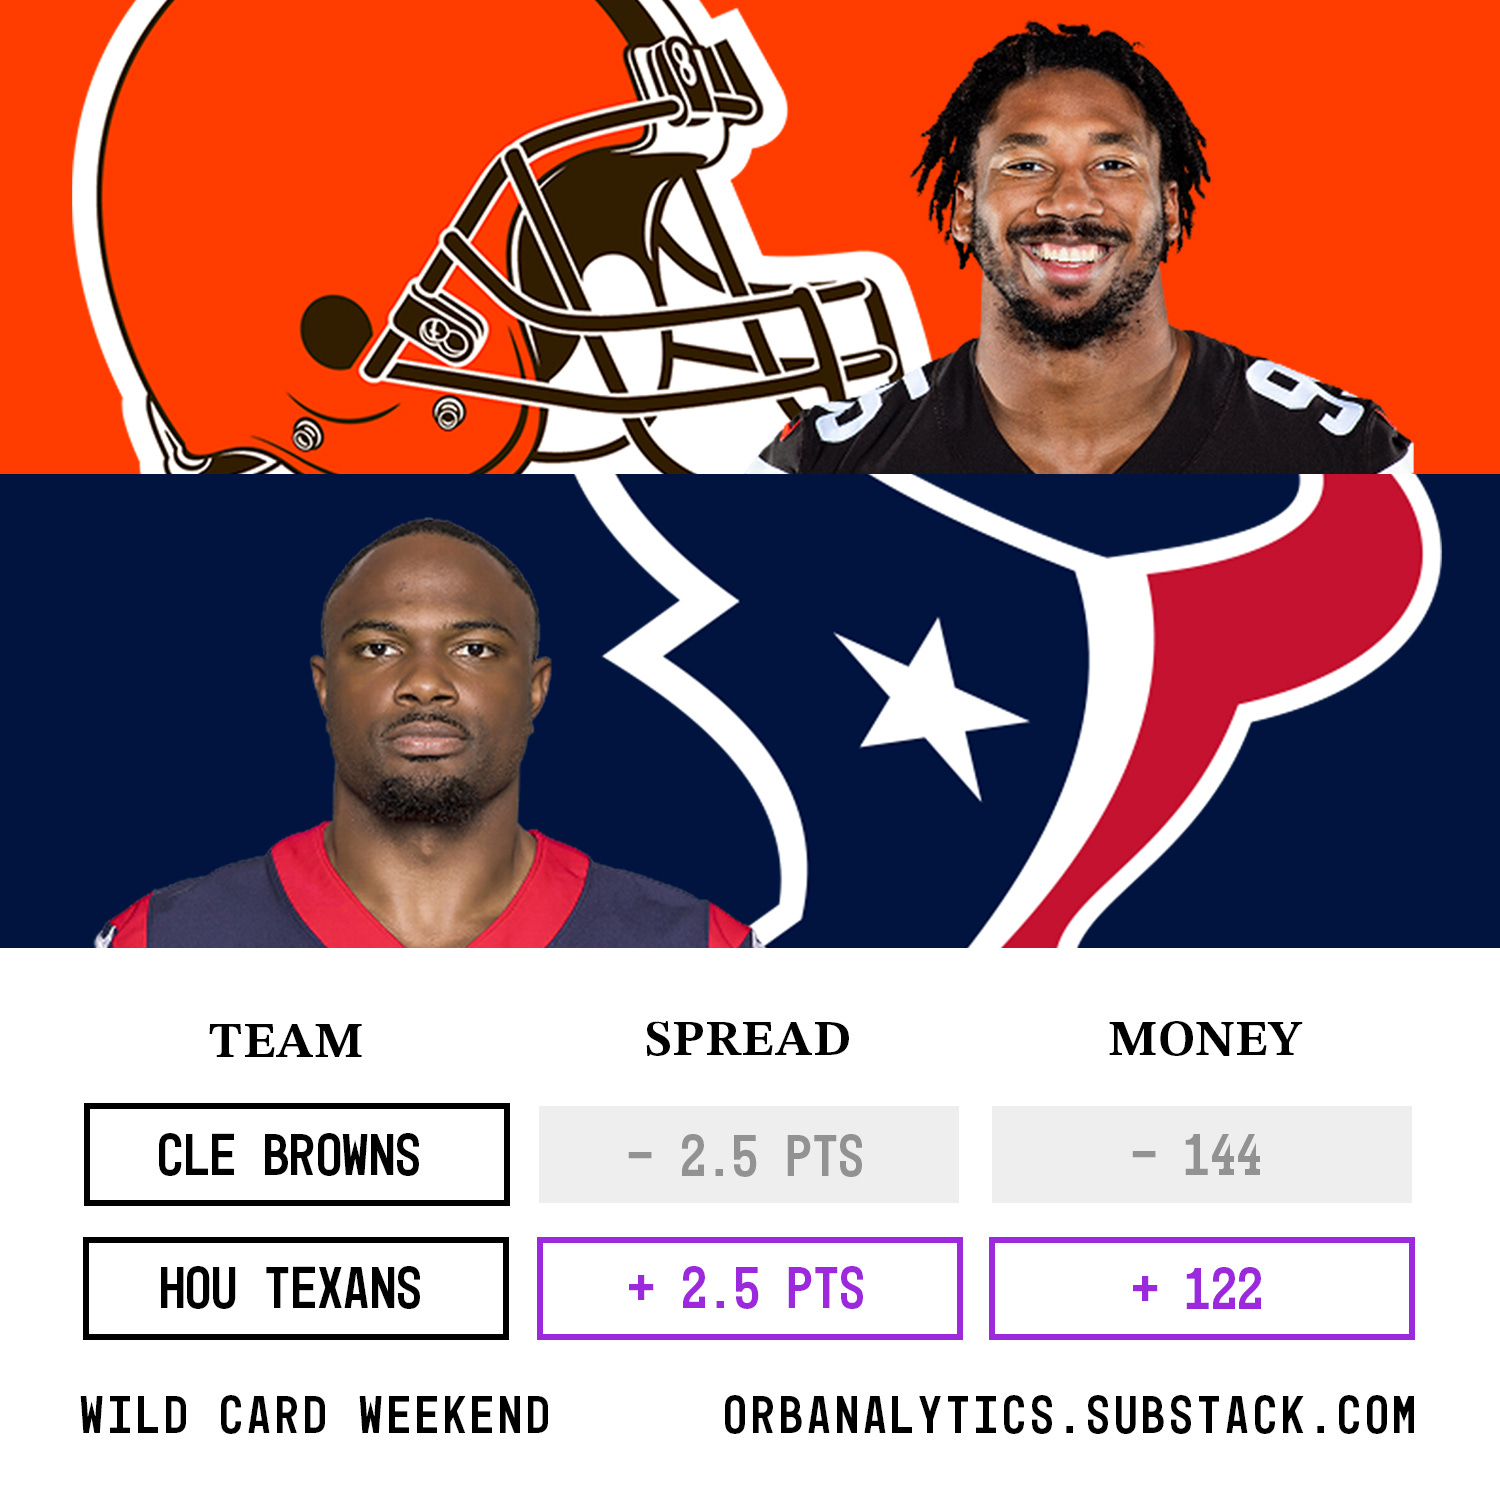
Spreads:
Texans +2.5
Chiefs -4.5
Lions/Rams - premium pick
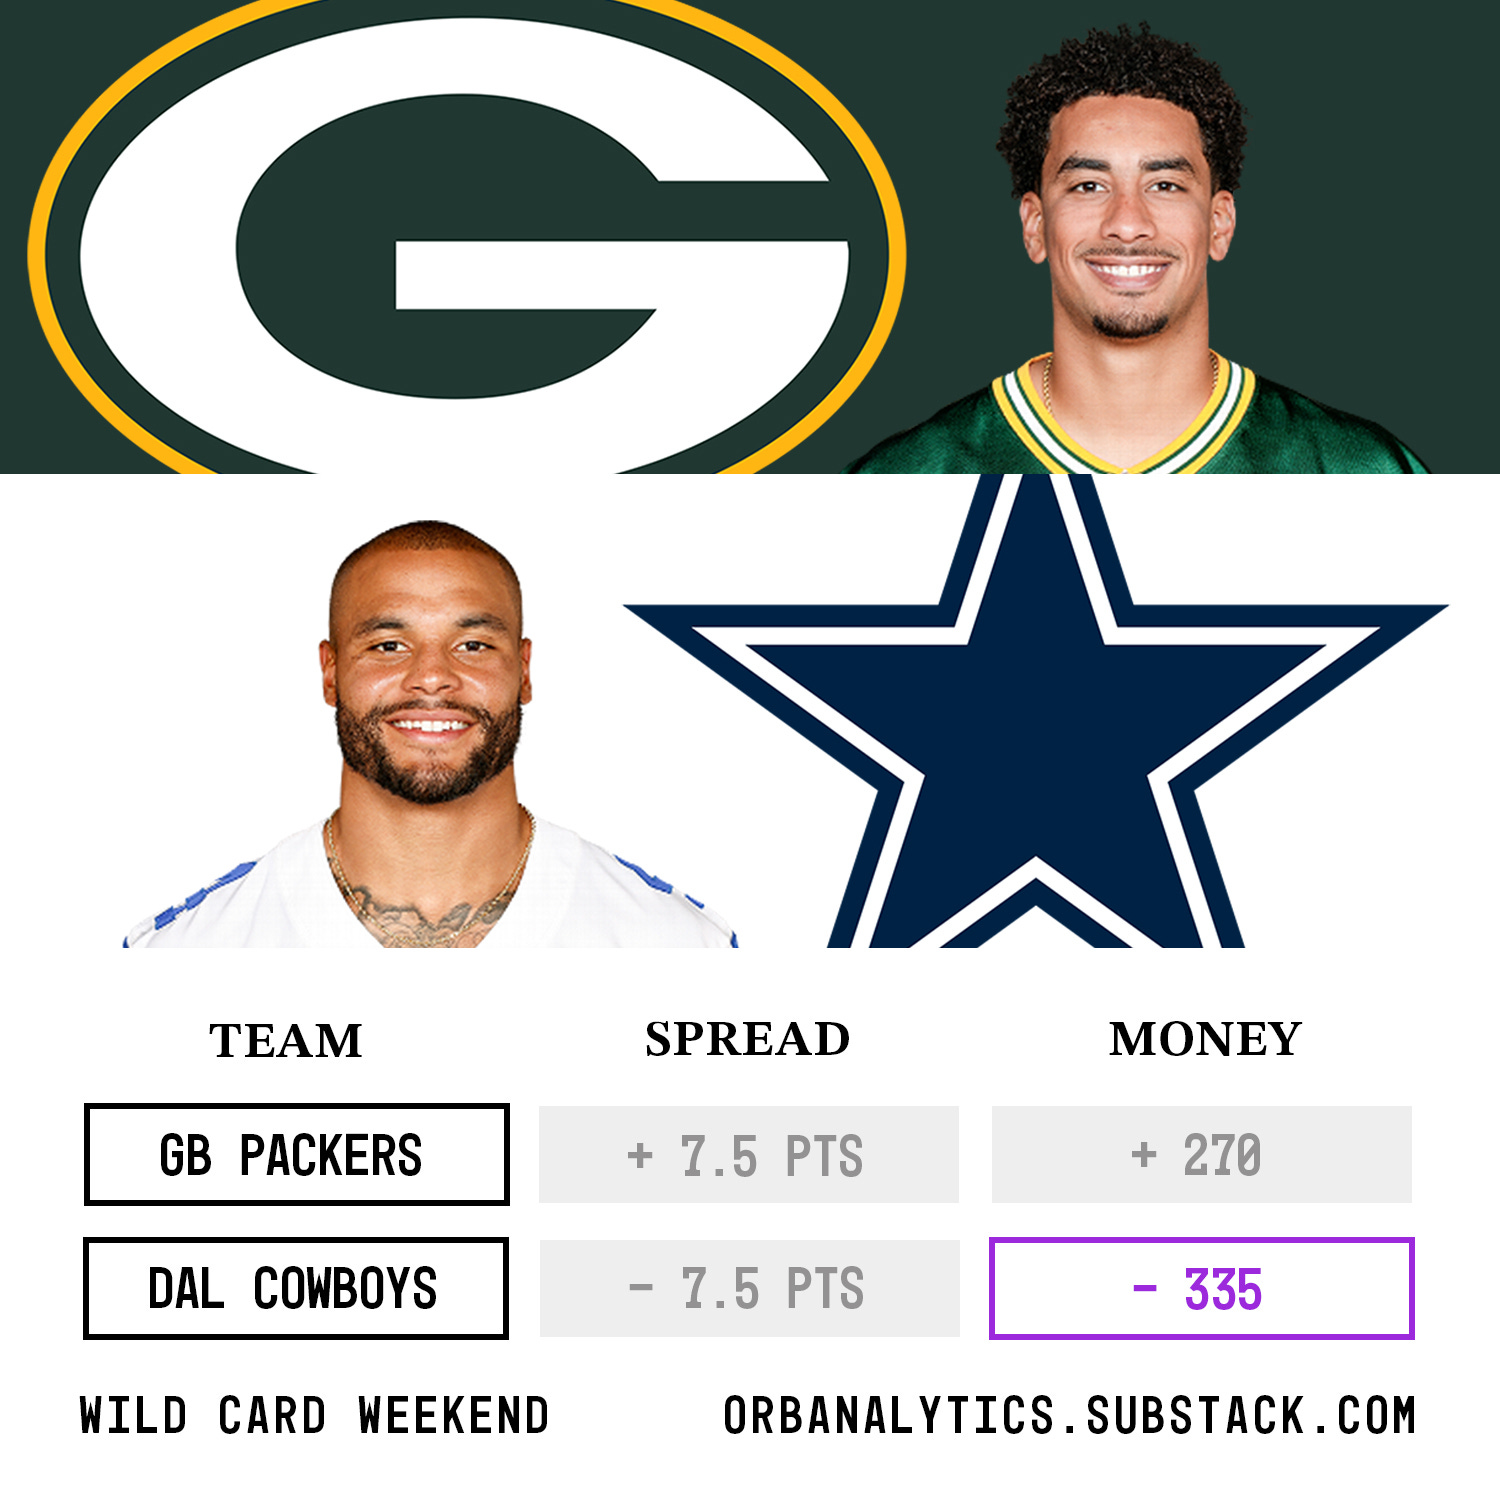
Moneyline:
Texans
Chiefs
Bills
Cowboys
Lions/Rams - premium pick
Thank you:
I don’t want to repeat any of the data analysis above, but rather just sincerely say thank you from the wizard behind the Orb. Even if our models hadn’t performed as well this season, it would still be a massive success in terms of the community we’re trying to build here. I don’t want to sound like a cheesy inspirational speaker or anything, but if you have a passion project that you’ve been hesitant to do, just go for it! I was terrified to start this thing and to put my work out there to the public. I was, and sometimes still am, afraid that the internet can be a nasty place and people would say negative things about this project that we put so much time and effort into. I was scared that the models could miss more often than they hit. Not only did we end up having a successful season in terms of performance, but more importantly all the feedback that Andy and I have received has been so positive and supportive, even when the models were missing. I know it sounds corny but every like + comment on these posts has meant a lot to us. Our models missed this season, quite a lot. 42 times against the spread and 47 on moneyline picks. And something that I can promise is that they are going to be wrong again in the future. But everyone who reads our content has stuck with us through misses and for that, I can’t say thank you enough. So again, if a couple of idiots like Andy and I can try and turn a passion project into something real, so can you!
- Team Orb Analytics
.
.
.
.
.
.
DISCLAIMER:
The information provided on this website is for informational purposes only. It is not intended to be gambling or financial advice, and should not be relied upon as such. We are not responsible for any actions or decisions taken by readers based on the information provided on this website.
The picks and predictions provided on this website are based on our own research and analysis and are intended to be used for entertainment and informational purposes only. We do not guarantee the accuracy or completeness of the information provided, and we are not responsible for any losses or damages incurred as a result of using this information for gambling or other purposes.
By accessing and using this website, you acknowledge and agree to the terms of this disclaimer, and you assume all risks and liabilities associated with your use of the information provided on this website.
Hell of a season guys 🫡
No other way to put it- this season has been a tremendous success for yall! Big congrats on that and I hope to see it continue in years to come!
It's really interesting you bring up the timing of the peak of the model's performance. I have actually have been thinking about that for a while now. I am hypothesizing that it could be a sweet spot for attaining enough information for who each team really is from a data perspective in a given season before more variance creeps in from the grind of the season. Any potential scheme and/or coaching changes that happen in the second half of the year could have an effect too...or maybe it's all just noise lol. Obviously hard to say after just one season but I am really curious and excited to see if this plays out similarly next year.