


Orb Analytics Week 9 Recap – Performance & Results


With the unofficial halfway point of the season here, we have a lot of information to throw at you and data to nerd out on. I split it up into three sections. The first is our normal weekend and season performance recap, with some exciting numbers coming off a great week 9. Then I take a look back at the lofty season-long goals and go through them to note which ones are on track to hit and which ones are not. Finally, I ran a fun Z-test analysis to highlight the Orb’s performance as a whole going back to last season and talk about the industry in general.
1. Week 9 and season-to-date model performance:
The Orb had an amazing performance in week 9! After a perfect Sunday on both spread and moneyline picks, our models stayed with the favorites and backed the Chiefs to cover Monday Night. While we at least got the moneyline win, we were on the wrong side of a Baker as the namesake himself covered in a losing effort. So just one missed pick all week and the wait for a perfect week against the spread continues. We will never complain about a 3-1 performance ATS and ultimately had our biggest +unit week so far this season thanks to a perfect run of moneyline predictions. Here is how each model pick performed in week 9:
Spreads:
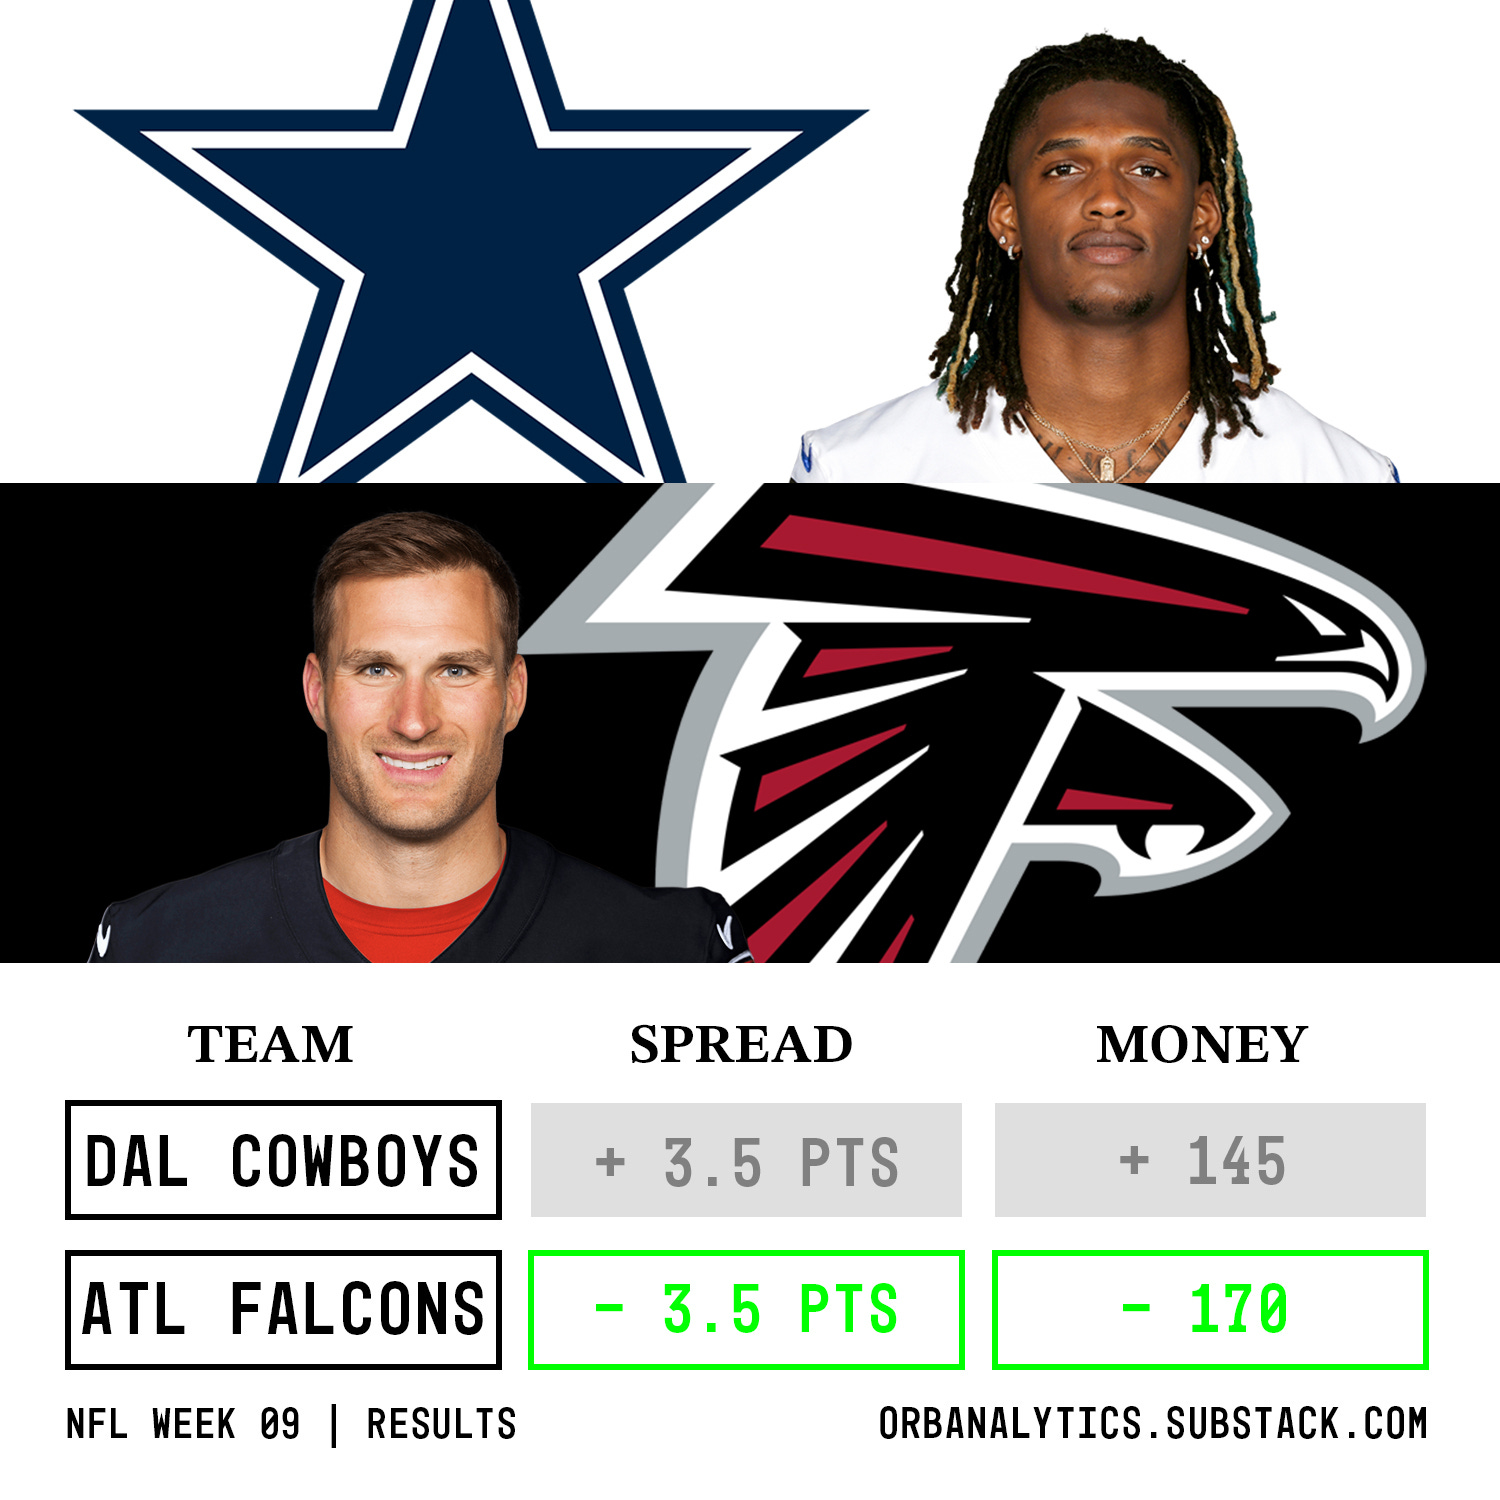
Falcons -3.5 ✅
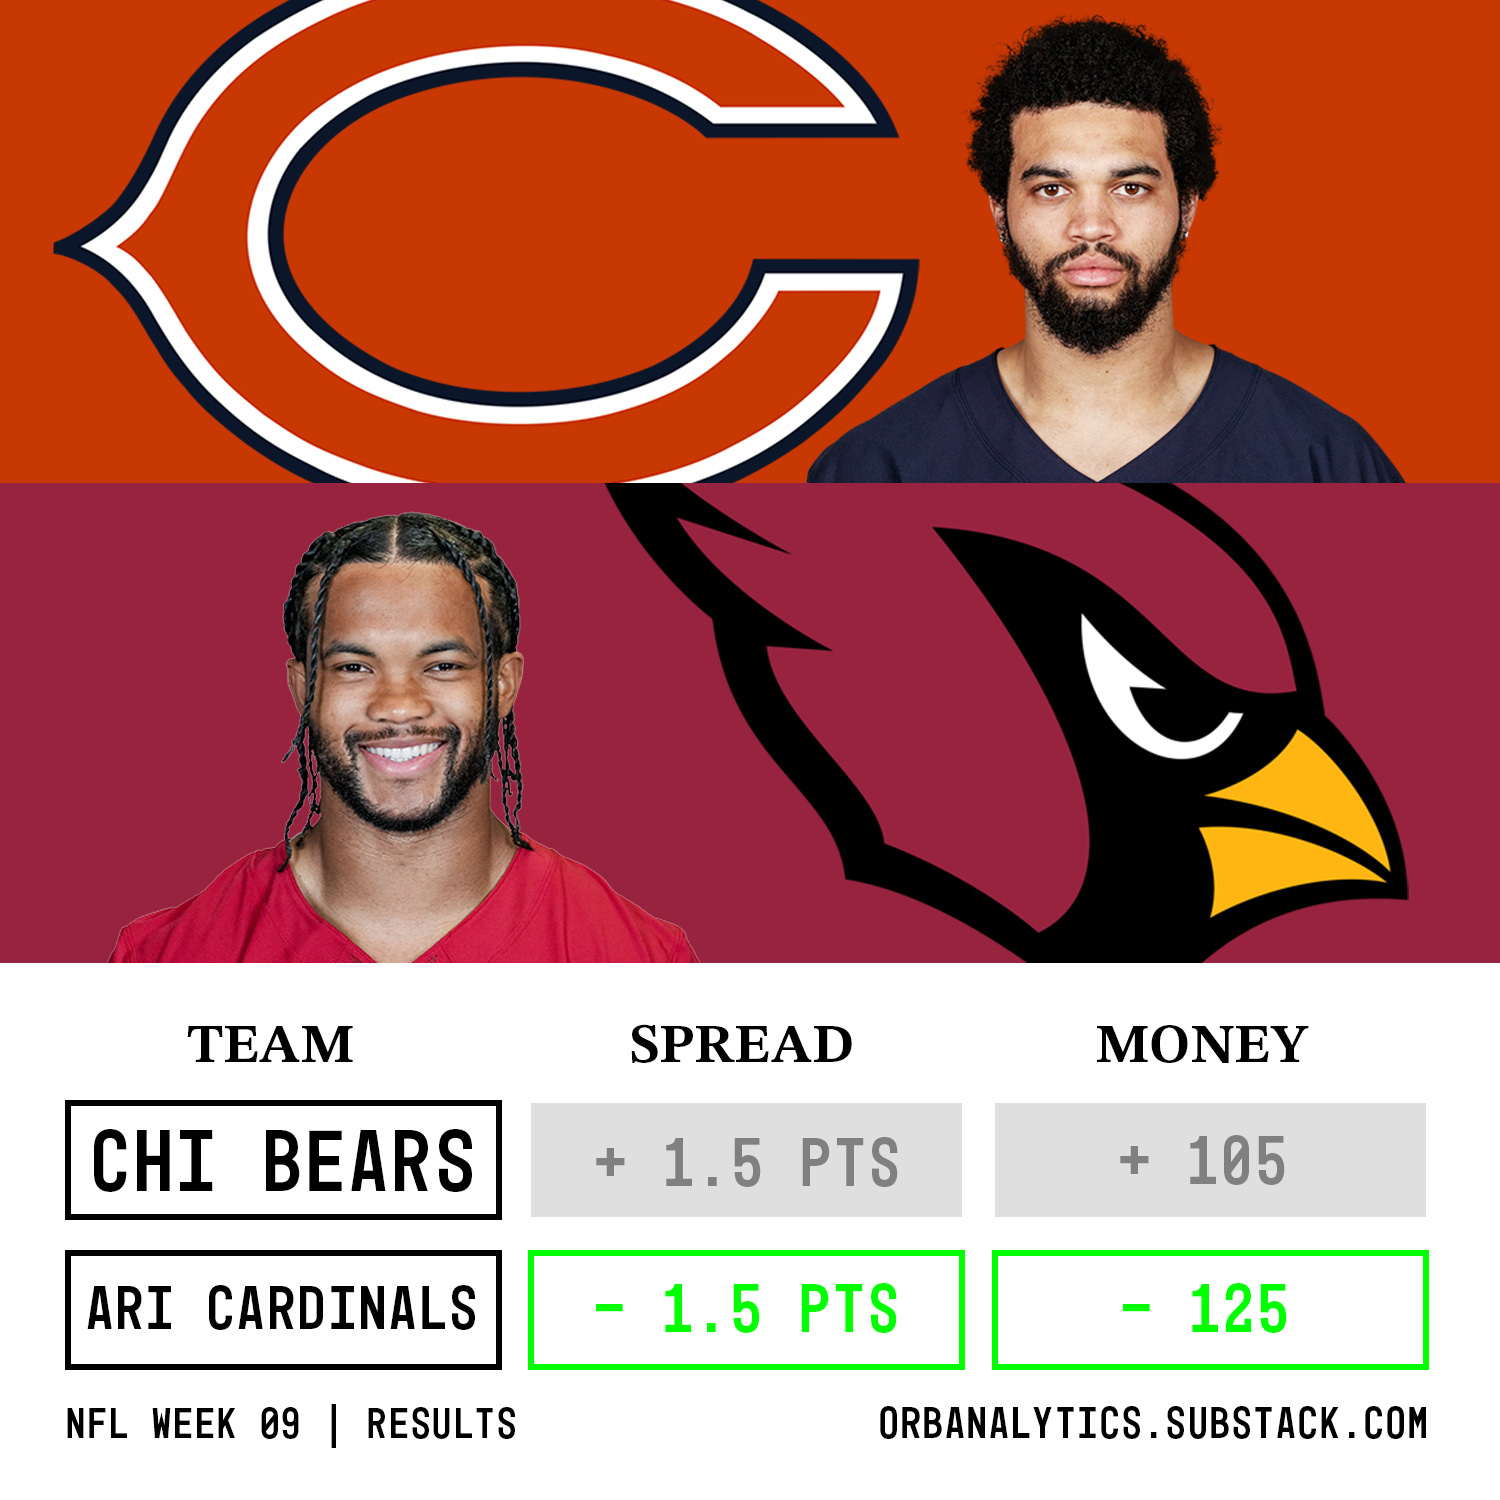
Cardinals -1.5 ✅
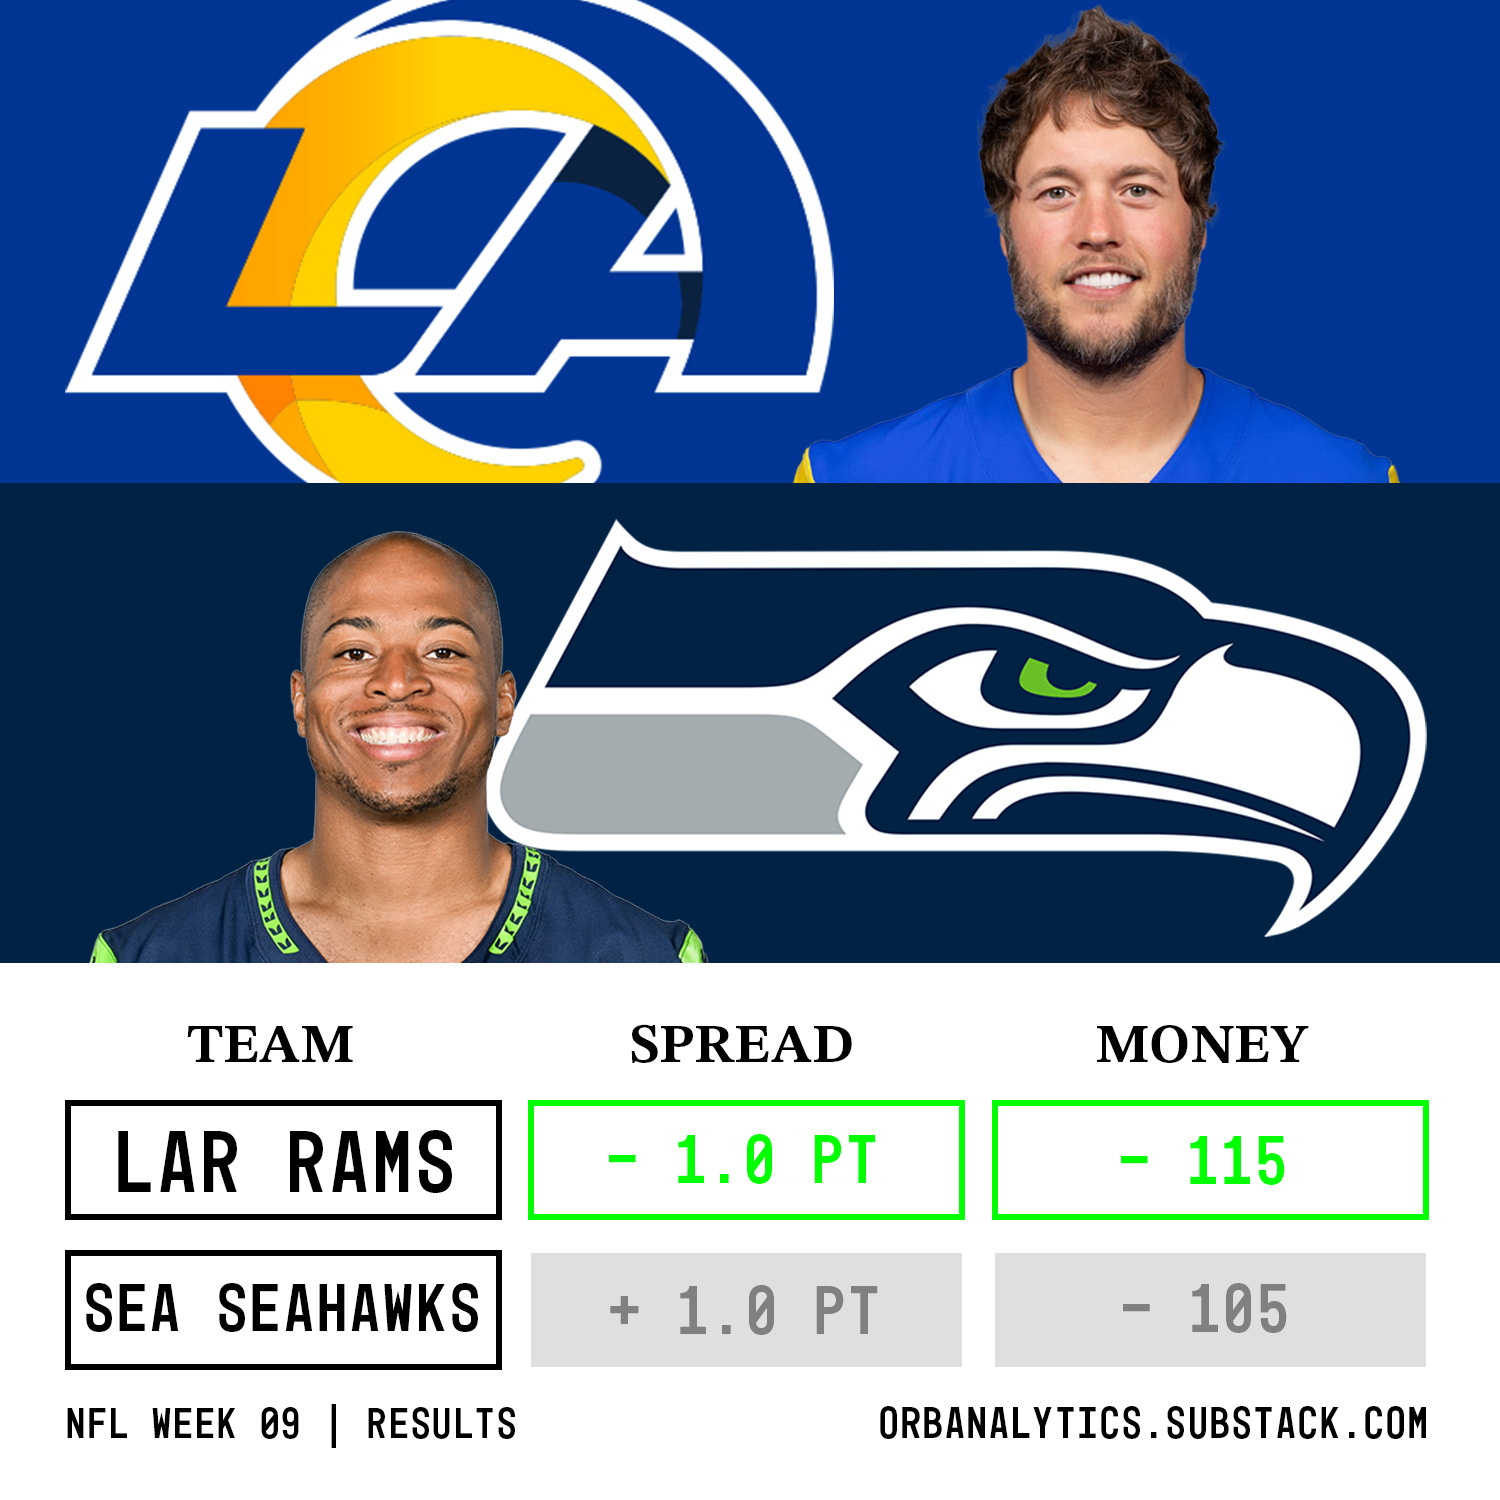
Rams -1.0 ✅
Chiefs -9 (MNF - Premium) ❌
All spread picks: 3-1, 75%, +1.727 units
Moneyline:
Ravens ✅
Bengals ✅
Bills ✅
Falcons ✅
Commanders ✅
Cardinals ✅
Rams ✅
Vikings ✅
Chiefs (MNF - Premium) ✅
All moneyline picks: 9-0, 100%, +4.253 units
Overall a +5.98 units performance.
Week 9 Model Performance:
Favorites covered 10/15 games (66.7%%) and won 14/15 outright (93.3%).
Weekly spreads:

Weekly Moneyline:
Season-To-Date Model Performance:
Not including week 1, favorites have covered 66/122 games (54.1%) and won 82/122 (67.2%) outright this season.
Season spreads:

Season moneyline:

Official Orb Picks Season Results:
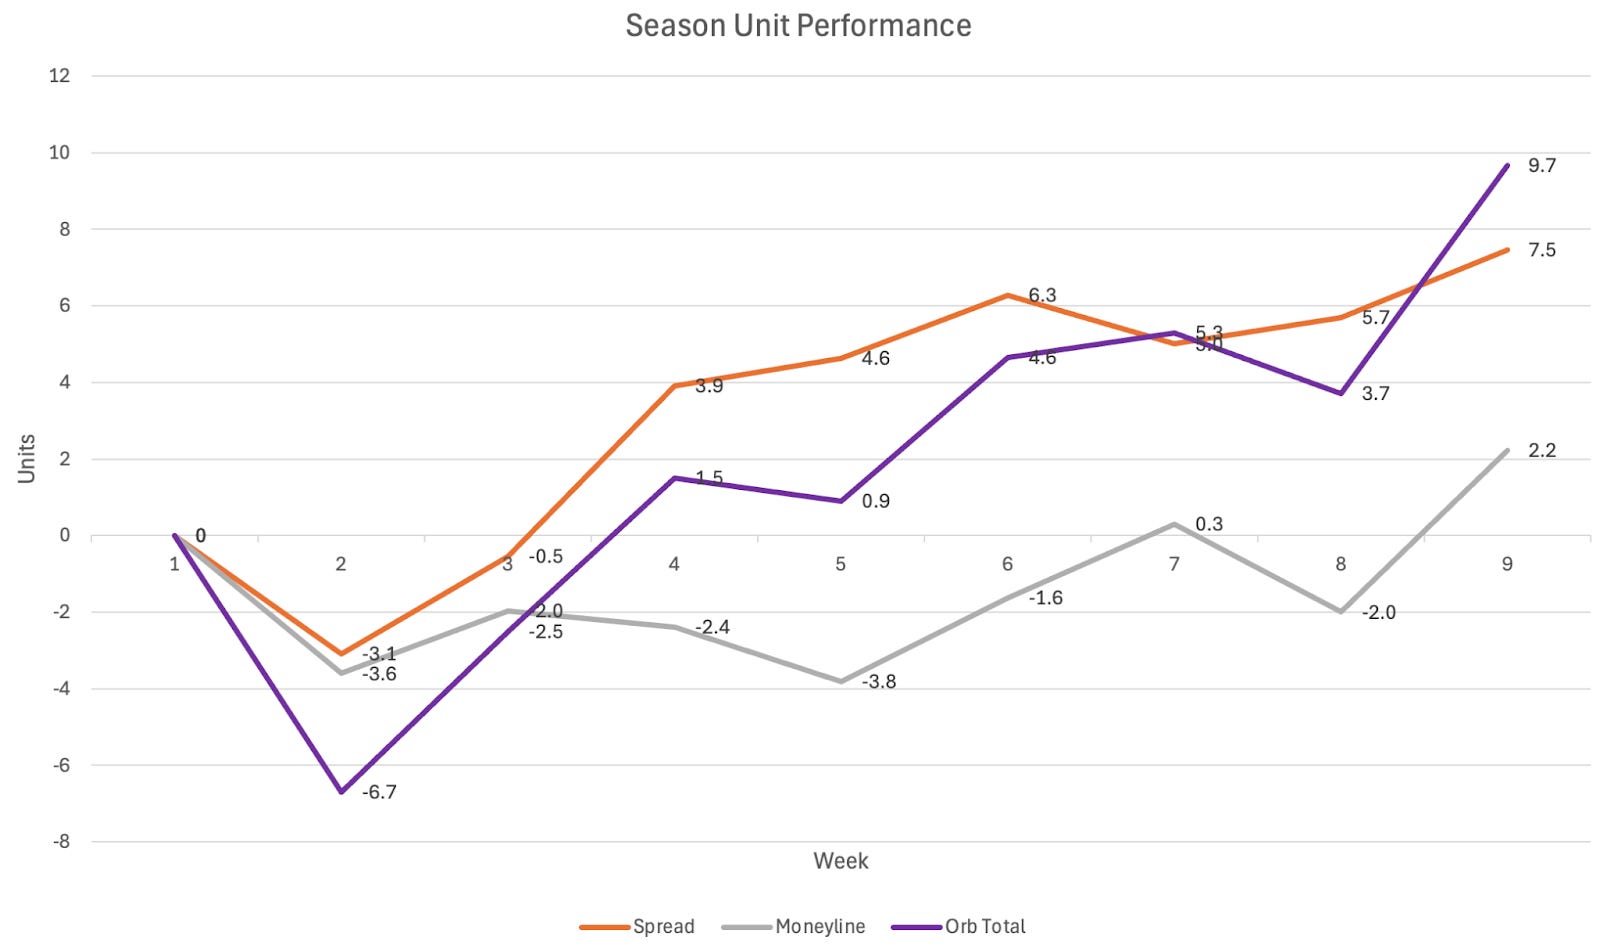
Season spread picks: 28-18, 60.9%, +7.5 units
Season moneyline picks: 48-24, 66.7%, +2.2 units

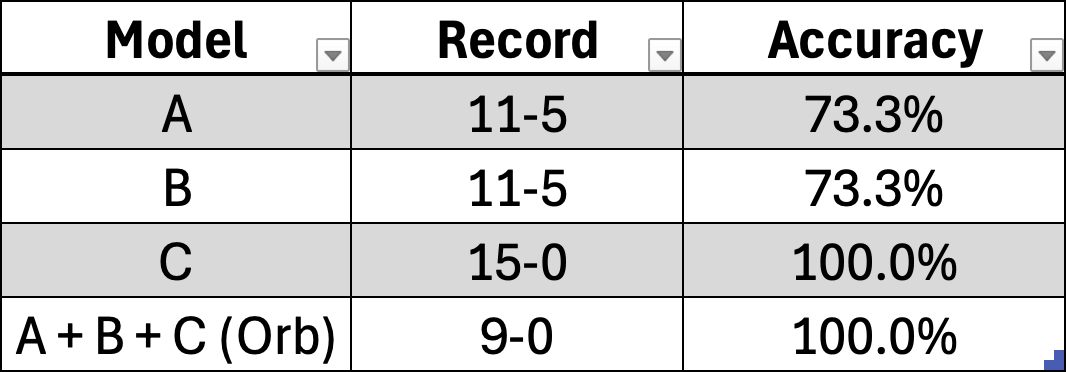
Confusion Matrix:

2. Half-way check-in on season goals:
Our main goal and focus for the Orb project each season is to build models that are profitable against the spread. This means hitting above 52.4% on spread picks for the season. This year I wanted to lay out some secondary goals for the models that I thought would be interesting to track. Some of these are fairly lofty goals and only have a chance to hit if everything goes our way this season. But through 9 weeks, a lot of things have and we are on track or close to being on track for many of them:
- Spread Goals
Goal: Hit above 52.4% against the spread
On track to hit? Yes. The Orb’s accuracy is 60.9%, 8.5% above our goal. This is our single biggest goal. If we finish the season above 52.4% ATS and miss every goal below, I will still deem it a successful year overall.
Goal: Hit above 52.4% when predicting both the favorite and the underdog to cover
On track to hit? Yes. The Orb is hitting 63.0% of the time when it picks favorites to cover and 57.9% when it picks underdogs to cover.
Goal: Have ‘high’ value picks hit at a higher rate
On track to hit? No. The majority of ‘high’ value picks came in the first two weeks of the season when team data was at its most volatile and they missed. Interestingly ‘Medium’ value picks have hit at the highest rate so far.
Goal: Have at least one model hit above 52.4% on its own for the whole season
On track to hit? Yes. Model B and C are each hitting 54.1% overall across every game.
- Moneyline goals
Goal: Be profitable
On track to hit? Technically yes. If we had done this exercise last week the answer would be no. Our moneyline models have been the one negative so far this season and have bounced right around the profitability line over the last few weeks.
Goal: Hit over 50% when predicting the underdog to win outright
On track to hit? No. The Orb is 3-4, 42.9% so far this season when all three models predict the underdog will win outright.
Goal: Hit at a higher rate than blindly picking every favorite to win.
On track to hit? No, but close. The Orb is hitting 66.7% on moneyline picks but favorites are winning 67.2% of the time. So only 0.5% behind our goal.
3. Z-test and accuracy significance:
Finally, I want to take a step back and look at the Orb’s performance overall dating back to last season. The multi-model approach we know today started last offseason, so we now have 1.5 seasons worth of data. While this isn’t the largest sample size, it’s enough to run statistical tests to check for significance. Statistical significance is kind of a big deal in this game. It’s a mathematical way of showing that our model’s results aren’t ‘luck’ and that they likely reflect a real predictive edge.
I ran a Z-test to check the significance of the Orb’s record against the spread over our sample size. I haven’t gotten to run one of these since college so I had to knock some of the rust off but had a blast doing so and re-learning parts of stats class. Since the beginning of the 2023/24 season, our models have made 155 spread predictions, going 91.5-63.5, or 59.0% accuracy. Z-tests require some assumptions, so they aren’t perfect: The biggest assumption that I had to make was about the true probability of hitting a given spread, and more so the expected probability of one’s accuracy picking against a larger sample of spreads. While markets, sharps, and public opinion may impact each singular pick’s probability to the point where it isn’t truly 50-50 odds, I would argue that over a large enough sample size the expected accuracy is 50% with normal distribution. So the results below are based on those assumptions.
Here is the visualization from our Z-test. I switched the X-axis from Z-score to accuracy so it is more intuitive and relevant:

The Orb’s accuracy of 59% over a 155-pick sample is 2.25 standard deviations above the mean of 50%. With the assumptions above, this not only exceeds our threshold for statistical significance but also indicates there’s only a 1.22% chance of achieving a 59% or better accuracy rate purely by chance if our models had no real predictive edge. This places the Orb’s performance so far in the top 1.22% compared to a baseline population that’s simply ‘guessing’ the outcomes. While I am extremely proud of the models being in the 98th percentile of this specific population, I am not showing this to brag but rather to talk about the industry and some of the false promises I see out there. Based on standard deviation, out of 1000 gamblers picking the same sample size here is how the accuracy breakdown would look:
68% have an accuracy between 46% and 54%.
95% have an accuracy between 42% and 58%.
99.7% have an accuracy between 38% and 62%.
When you see someone online talking about how they hit 70+% against the spread over a significant sample size, know that they are either about 1 in 3.5 million of the population and truly an oracle, or they might not be telling you the whole truth. Sample size matters and picking accurately against the spread is hard! You need a lot to go your way from data, gut feelings, and sometimes pure luck. If something seems too good to be true, it often is and the math will always back that up. Predicting accurately above 50%, and particularly above 52.4% should be celebrated. Inversely, if you are somehow picking below 38% against the spread, you may be down a ton of money but you are in elite company as just 0.13% of people are able to do so with the assumed 50% accuracy rate. Knowing who not to pick is just as difficult and valuable in a binary outcome excluding pushes.
Thanks as always for following along and supporting the Orb project. Let’s have a great second half of the season!
- Team Orb Analytics
.
.
.
.
.
.
DISCLAIMER:
The information provided on this website is for informational purposes only. It is not intended to be gambling or financial advice, and should not be relied upon as such. We are not responsible for any actions or decisions taken by readers based on the information provided on this website.
The picks and predictions provided on this website are based on our own research and analysis, and are intended to be used for entertainment and informational purposes only. We do not guarantee the accuracy or completeness of the information provided, and we are not responsible for any losses or damages incurred as a result of using this information for gambling or other purposes.
By accessing and using this website, you acknowledge and agree to the terms of this disclaimer, and you assume all risks and liabilities associated with your use of the information provided on this website.
Orb obsolutely crushed it this week! Congrats guys. I had no idea until now that you bit every moneyline pick. 💪