


Orb Analytics Week 15 Recap: Andy Diamonds’ “Aha Moment” During Sunday’s Slate


The Orb had another solid performance in Week 15, going +units on both spread and moneyline picks. The models have responded to their worst-ever losing streak with back-to-back winning performances on small-volume weeks. Every win and loss against the spread down the stretch of the regular season has a big impact on which side of our 52.4% target goal.
Stay tuned below for our usual performance data visualizations and for an analysis we ran to see how often our multi-model strategy has prevented us from giving out losing picks. First, here are some quick high-level takeaways from the games the Orb had official picks in.
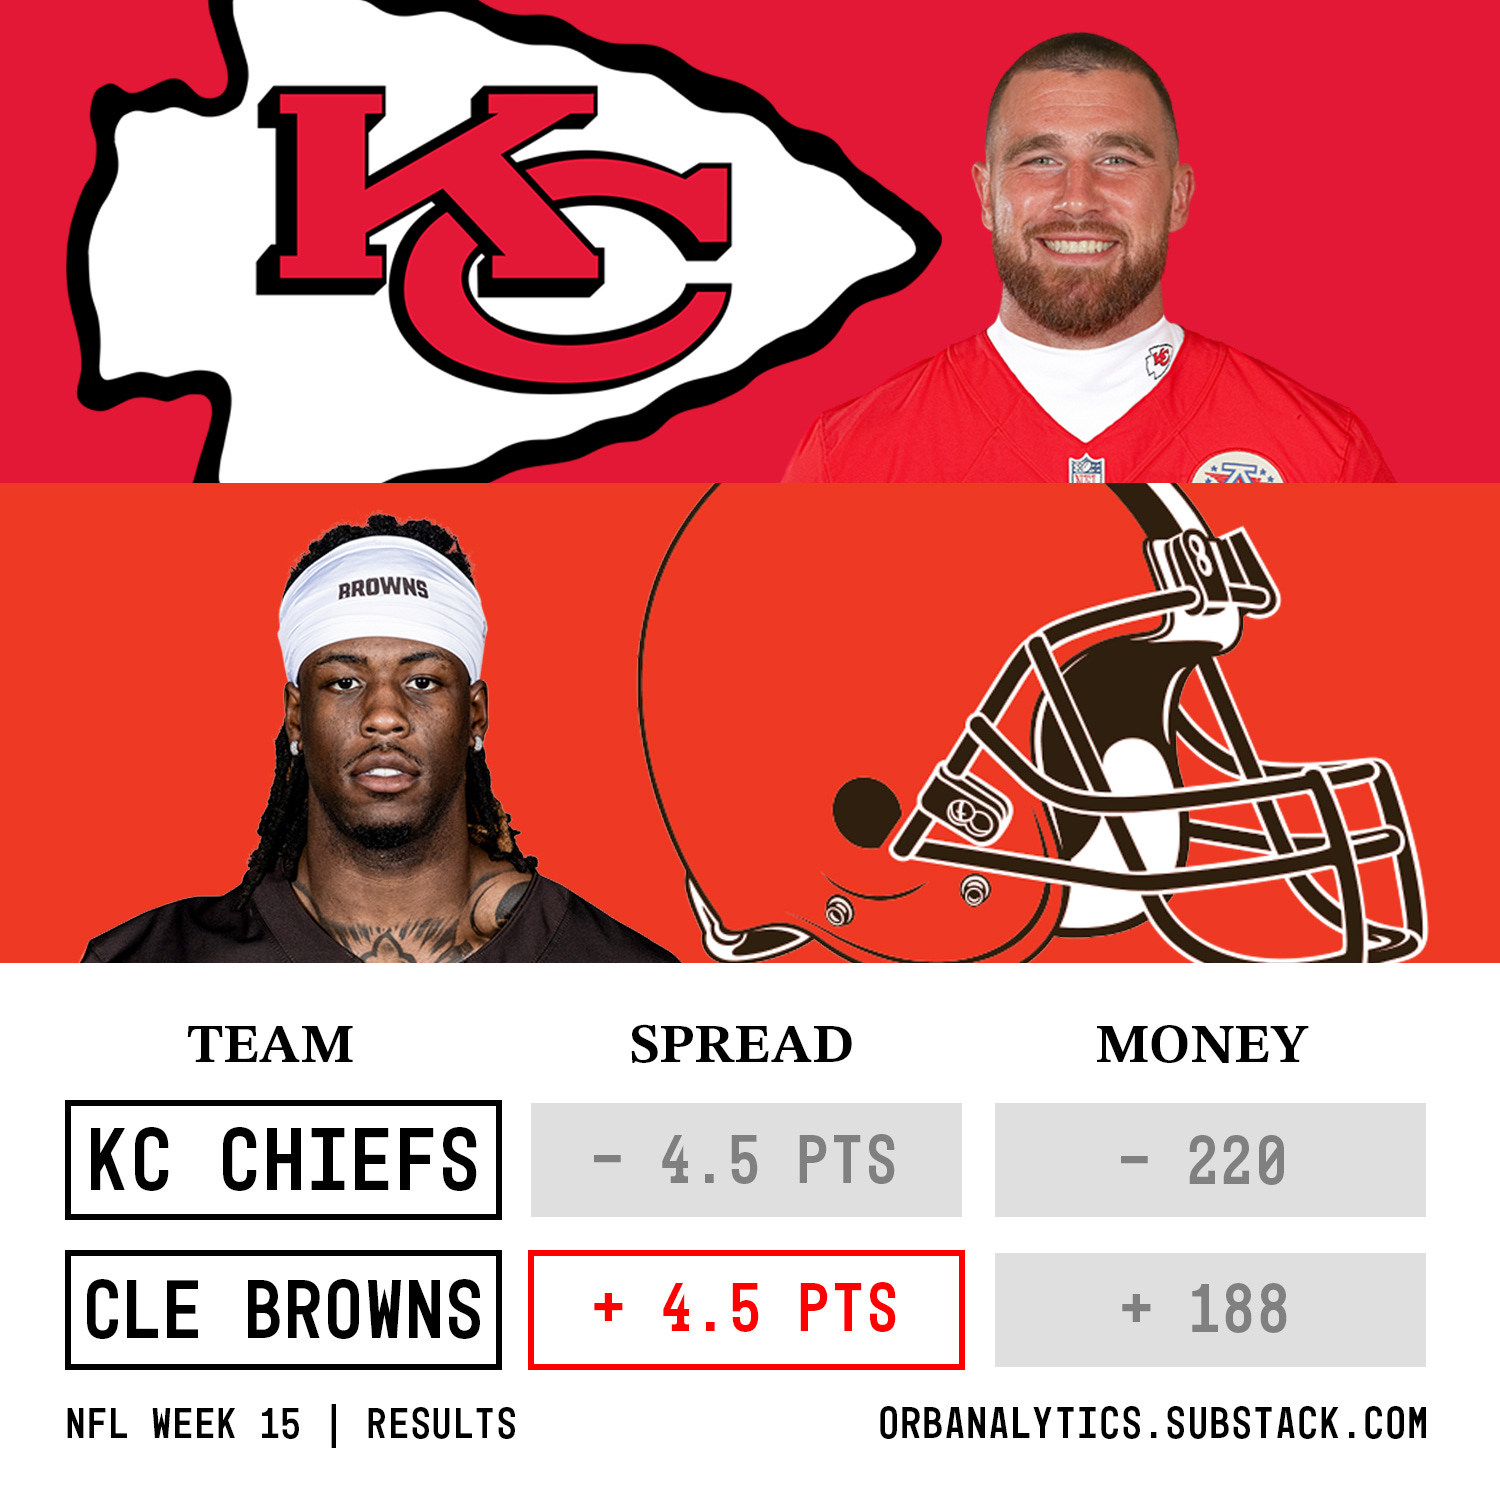
Jameis giveth and Jameis taketh away. Even in a winning week, it is important to highlight when the models miss so let’s start with the Browns-Chiefs game. While being the most fun and unpredictable quarterback under center can lead to underdog upset wins, it can also lead to what we saw on Sunday. If our team doesn’t have a franchise-caliber quarterback, we as fans typically at least want the most exciting or promising option. I think Jameis’ performance showed us why NFL coaches often elect to go with the higher floor/lower ceiling safe option rather than giving us what we want. You can gameplan a win around a 15/20, 120-yard, and 0-turnover performance. It is harder to win when your quarterback throws 3 interceptions and the rest of the team adds 3 more.
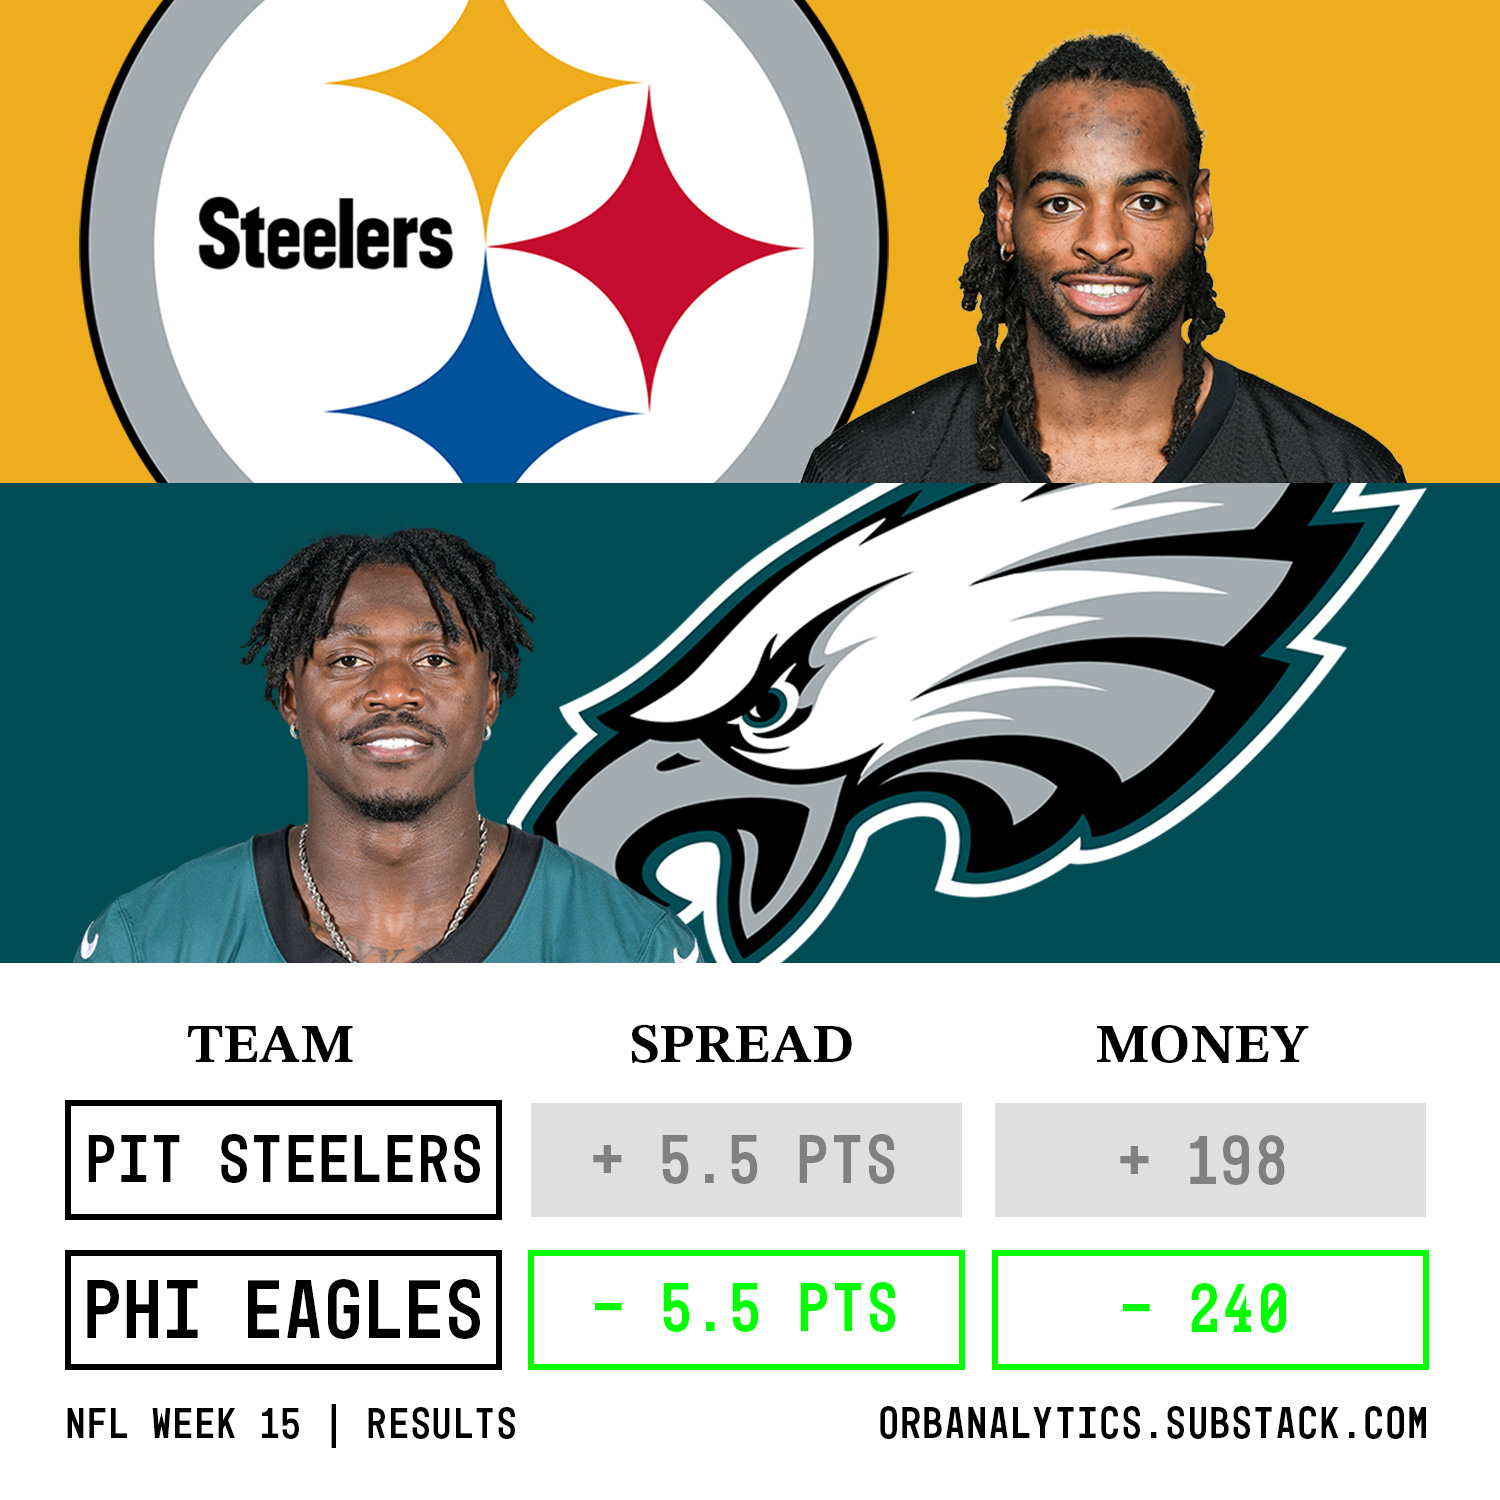
A shake-up among the top of the league? After losing as favorites last week, Buffalo earned the most impressive win of the weekend in Detroit. The Lions’ injuries continue to pile on while the Eagles’ arrow continues to only point up. Good luck sorting the elite teams out against one another. Thankfully, that is what the playoffs are for and we should be in store for some amazing matchups.
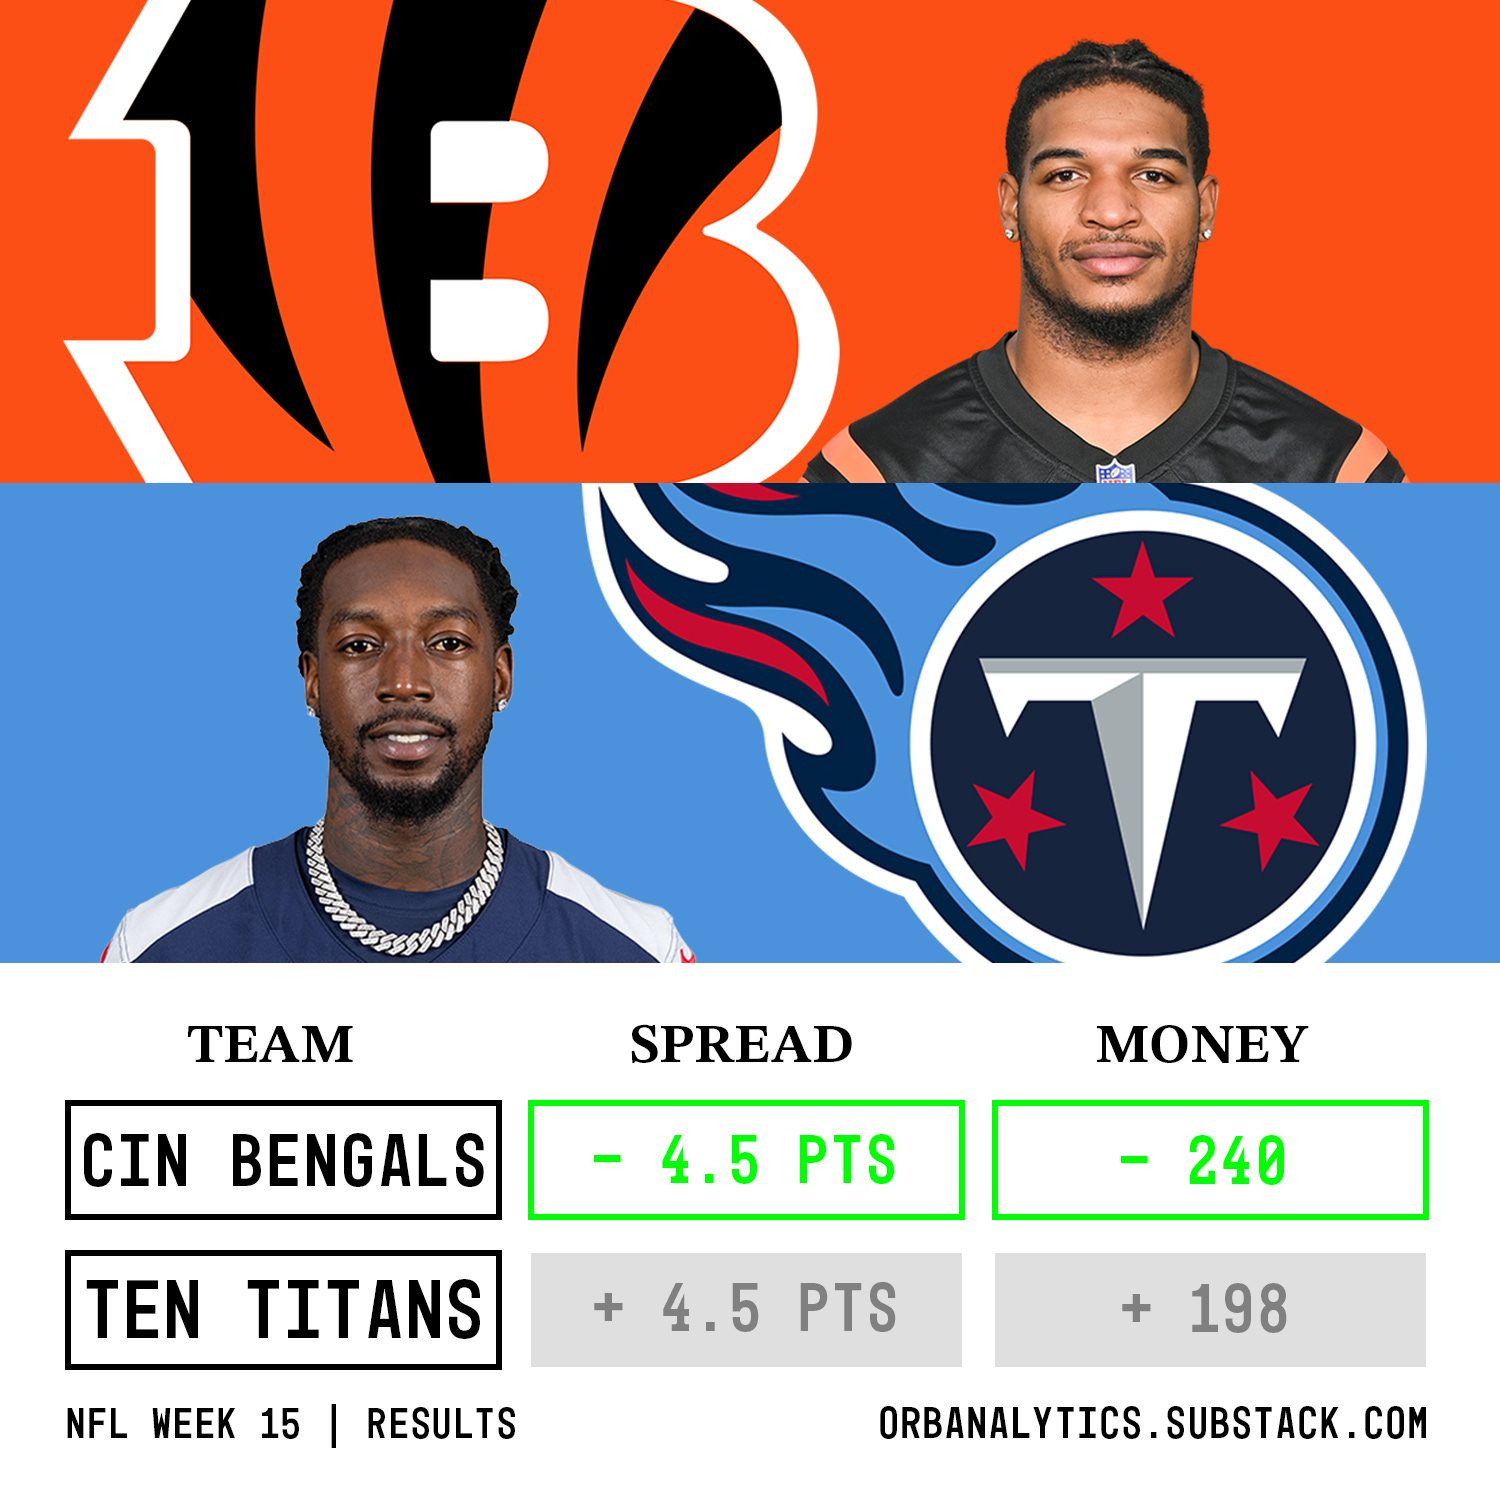
Too little too late for the Bengals. The Orb has won back-to-back weeks picking the Bengals to cover as favorites, but the wins are more impactful to us than they are for Cincinnati. Their playoff probability has now increased ever so slightly to 5% on NFL.com but it will take a miracle to see them play mid-January, as fun as this offense is to watch.
Here is how each pick from the Orb performed in Week 15:
Spreads:
Bengals -4.5 ✅
Browns +4.5 ❌
Eagles -5.5 ✅
All spread picks: 2-1, 66.7%, +0.818 units
Moneyline:
49ers (TNF - Premium) ❌
Commanders ✅
Bengals ✅
Ravens ✅
Eagles ✅
Packers ✅
Vikings (MNF - Premium) ✅
All moneyline picks: 6-1, 85.7%, +1.145 units
Overall a +1.963 unit performance.
Week 15 Model Performance:
Favorites covered 11/16 games (68.8%) and won 12/16 outright (75.0%).
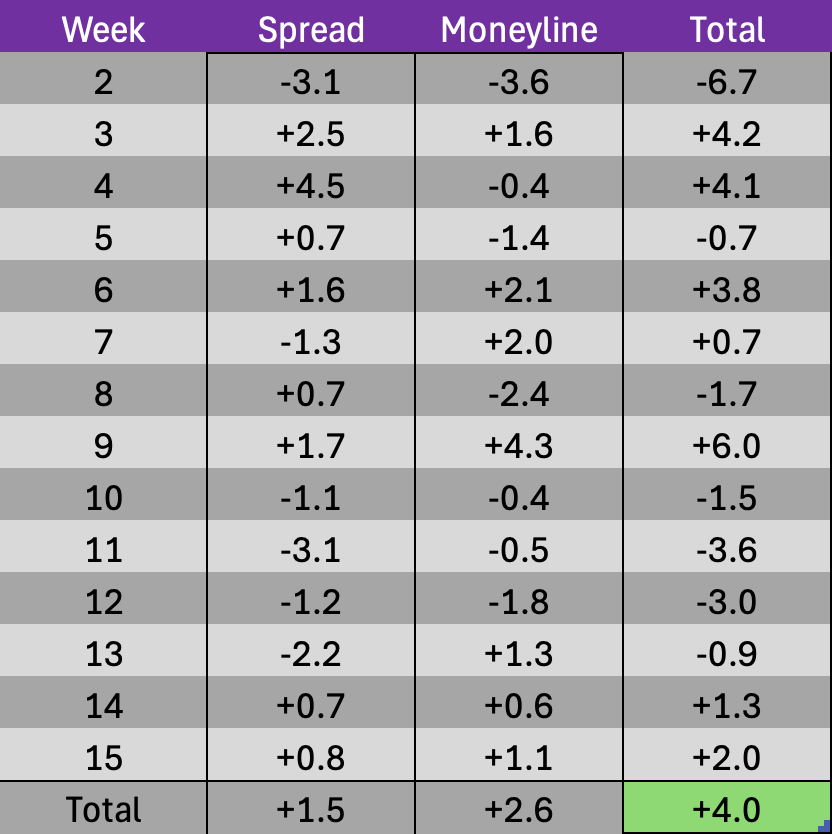
Weekly spreads:

Weekly Moneyline:

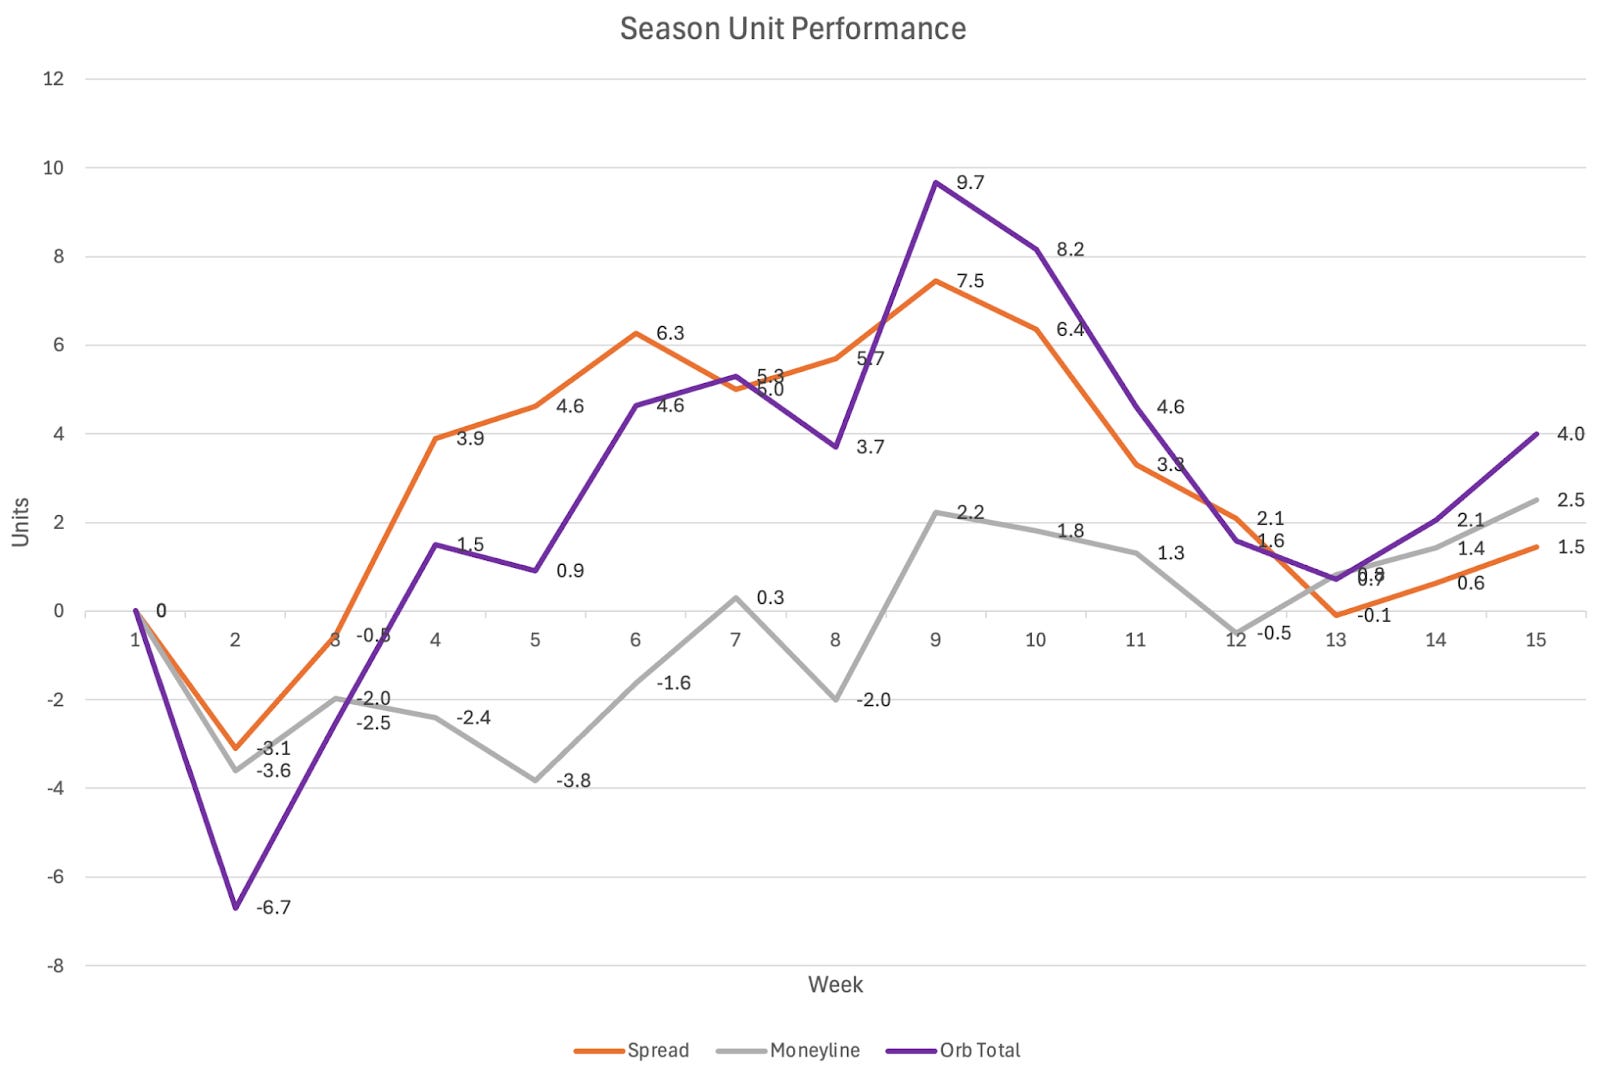
Season-To-Date Model Performance:
Not including week 1, favorites have covered 111/208 games (53.4%) and won 146/208 (70.2%) outright this season.
Season spreads:

Season moneyline:
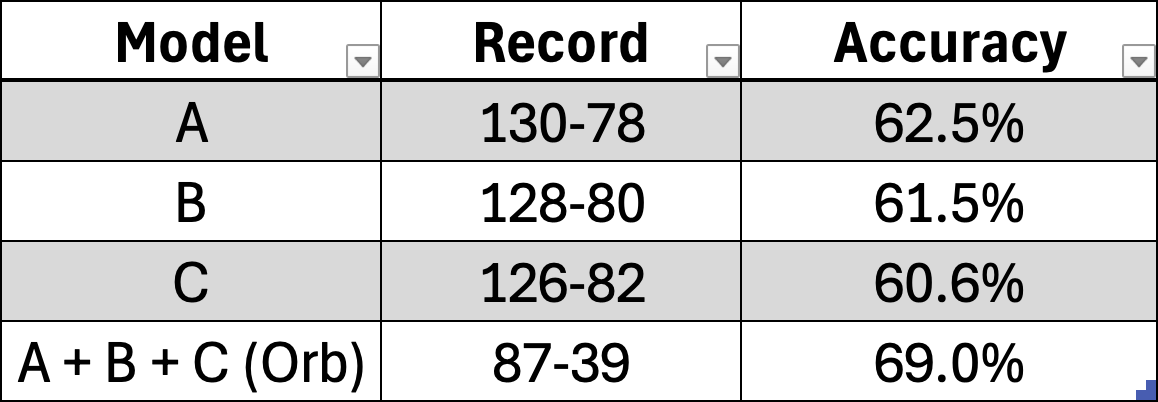
Official Orb Picks Season Results:
Season spread picks: 39-34, 53.4%, +1.5 units
Season moneyline picks: 87-39, 69.0%, +2.6 units
Confusion Matrix:
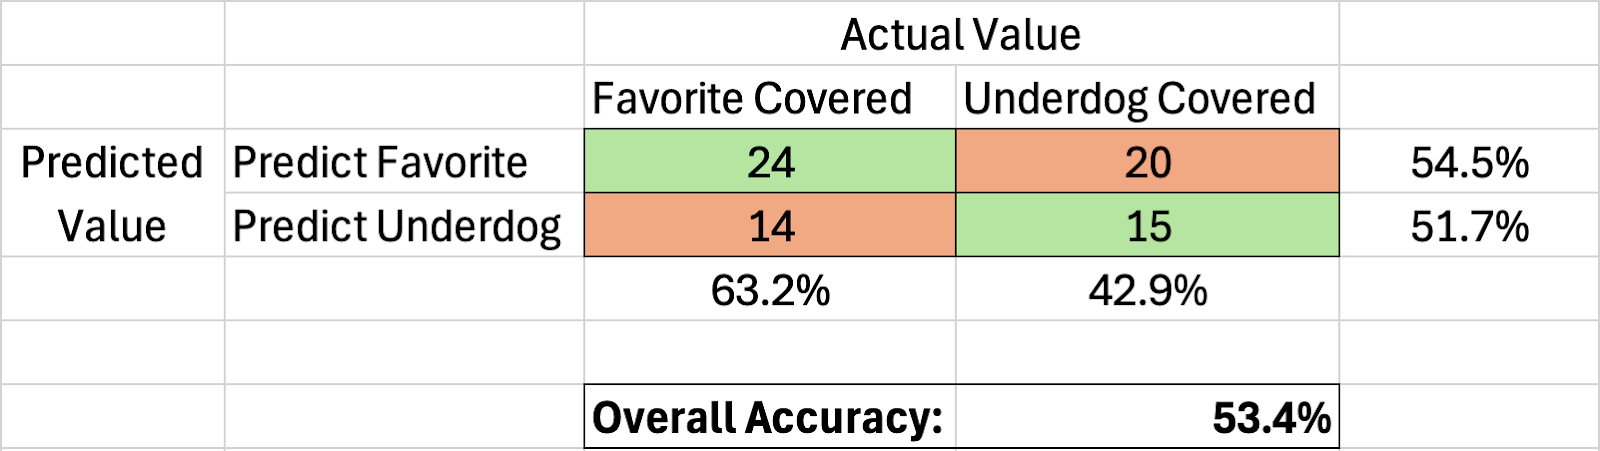
One quick note to highlight before we get into our new ‘save rate’ internal metric. As seen above, favorites are absolutely dominating this season. They have covered 53.4% of all games since week 3 and while this may not sound like a lot, the 3.4% upper hand over underdogs against the spread is as imbalanced as we’ve seen at this point in a season since starting the project. For reference, last season between weeks 2-15 favorites covered 52.8% of the time which is a lot. You have probably heard that the public is doing great this season and since they typically bet on favorites, this would be a big reason why. A fun coincidence is that their cover, not including week 1, is exactly the same as the Orb’s heading into week 16. Who needs data science when you can build a model that says ‘always take the favorite.’
Save Rate Analysis:
As you may have noticed from this week’s results, the models didn’t make any official spread picks in the non-Sunday games. Meaning each game had two models that agreed on the spread outcome and one that disagreed and was on the other side. I have been trying to highlight when the model that disagrees has prevented us from giving out a winning pick versus when it has saved us from agreeing with the others and giving out a consensus losing pick. A big shoutout to Andy Diamonds who called me and asked if we could quantify how often each was happening to try and get a different sense of how well our modeling strategy is working beyond its record when the models all agree.
The minimum threshold has been that all of our models need to predict the same outcome for a pick to be given out. Since forming the current version of the Orb, this has led to the following results against the spread:
2023 season: 60-42-7, 58.2%, +12.5 units
2024 season to date: 39-34, 53.4%, +1.5 units
Overall: 102.5-79.5, 56.3%, +14 units
But now the question is how has the model performed on picks that leaned one way but only had 2/3 of the models backing them? For this exercise, I took a look at these and measured their accuracy as if the side that the models were leaning toward were official picks. So a game in which two models backed the favorite but the third was on the underdog would count as a pick on the favorite. It isn’t a perfect analysis as some games have been manually removed due to starting quarterbacks being out and data can always be cleaner. But I was able to find 76 games this season and 166 overall dating back to last season that qualify you and the results are staggering, to say the least.
Here is how the ‘lean picks’ that didn’t have the full backing of all three models would have performed:
2024 season to date: 33-43, 43.4%, -13 units
Overall: 77-89, 46.4%, -19 units
My hypothesis going into this was that we would have a cascading range of accuracy. Picks that three models all agreed one would have the highest hit rate, followed by the lean that two models were on, and finally the side that only one model took. I was dead wrong, as the data suggests our modeling strategy has led to a successful binary, all-or-nothing approach. Hence why we are naming this the strategy’s “save rate”. By having one model disagree, therefore not giving out a pick, and lowering our volume to only predictions that meet the 3-model threshold, we have saved ourselves many units and percentage points.
For this season, the Orb is hitting 10.0% higher on official consensus picks than it is on picks in which the models are leaning one way. If we were to add the ‘lean picks’ results to our season record, it would bring our season numbers against the spread to 72-77, 48.3%, -11.5 units. So our official ‘save rate’ this season is the 5.1% difference between that hypothetical 48.3% accuracy and the 53.4% accuracy that the Orb is officially sitting at heading into week 16. Meaning the model has saved us 5.1 percentage points in our accuracy. The hypothetical record including the 2023 season would be 179.5-168.6, 51.6%, -5 units. So one model disagreeing has saved the project 4.7 percentage points on our official record so far.
The results of this analysis amplify a theory Andy and I will continue to promote: There is action in inaction. This is what we define as responsible gaming and I write about how sometimes the best pick you make is the one that you don’t and our modeling strategy so far backs that up. Not giving out a pick because the models do not agree is as impactful to the project’s success as giving one out. When the Orb doesn’t make a spread pick on a game it is because it does not have a strong enough statistical edge to make a confident prediction.
Andy Diamonds’ “Aha Moment”
Here is a testimonial from Andy Diamonds himself seeing this play out in real-time on Sunday:
Orb Faithful,
Andy Diamonds here with a quick story from this past Sunday that perfectly illustrates why our model system is so impactful.
While watching RedZone, I was annoyed / borderline upset that the Orb didn’t pick the Commanders to cover the spread against the Saints. I felt like this was going to be an easy winner, and I had an emotional reaction. As the 4th quarter wound down, the Saints suddenly were lining up for a two-point conversion to win outright on the final play.
In that moment, it hit me: this is exactly why our modeling strategies matter. Despite my gut instincts and emotions tempting me to place a unit on the game, the system helped me stay disciplined. There are no “easy winners” in sports gambling. By allowing for disagreement among our models, we gain deeper insights—not just into where to place bets but also into which games are best to avoid.
Sometimes, the smartest play is no play at all.
Stay sharp,
Andy Diamonds
- Team Orb Analytics
.
.
.
.
.
.
DISCLAIMER:
The information provided on this website is for informational purposes only. It is not intended to be gambling or financial advice, and should not be relied upon as such. We are not responsible for any actions or decisions taken by readers based on the information provided on this website.
The picks and predictions provided on this website are based on our own research and analysis, and are intended to be used for entertainment and informational purposes only. We do not guarantee the accuracy or completeness of the information provided, and we are not responsible for any losses or damages incurred as a result of using this information for gambling or other purposes.
By accessing and using this website, you acknowledge and agree to the terms of this disclaimer, and you assume all risks and liabilities associated with your use of the information provided on this website.
Love the insight on how much of a difference the full consensus makes! Doesn't surprise me one bit