This season we ran a weekly Snapshot Analysis for our paid readers that did exactly that. We used data visualizations to show where teams in the league compared to one another in certain statistics heading into the weekend. A lot of this data comes from our friends at Pro-Football-Reference which is a fantastic website (go check them out) but unfortunately it doesn’t update team stats throughout the playoffs - or at least it didn’t last season so that is my assumption this year as well. So we have put together a one-time data guide for the playoffs that you can reference between now and the Super Bowl.
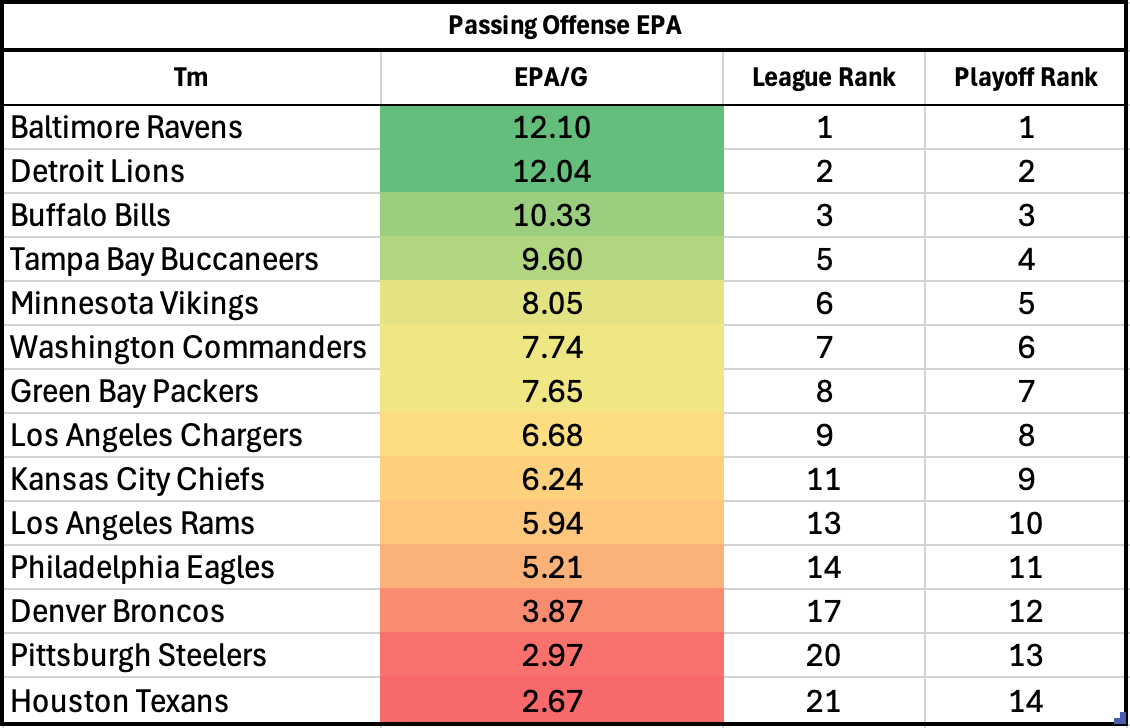
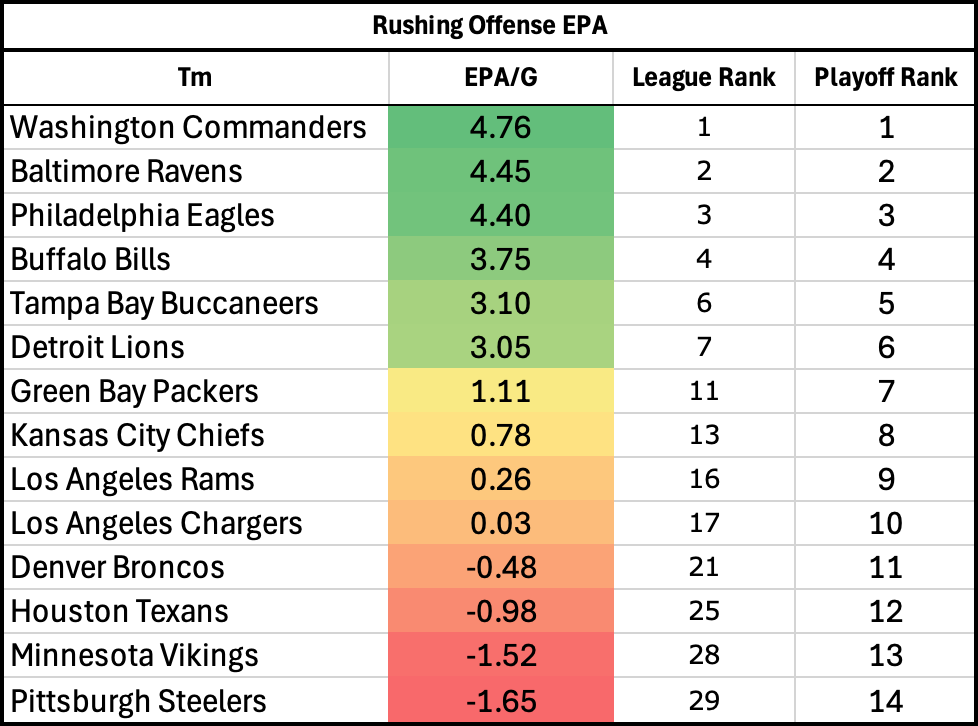
One of the advanced statistics we use here is Expected Points Added (EPA). More specifically we look at EPA per game. No single stat will ever perfectly encapsulate a team or a unit’s efficiency, but I believe EPA is as good as any of them and tells us valuable information. For offense, a good efficient offense like the Lions is represented by a large, positive EPA. Defensively, I have flipped the sign because it makes more intuitive sense to me that a good defense like the Broncos is represented by a negative number. Think about it as points that the defense is taking away from the offensive.
For as many charts as possible, I have filtered for team data to exclude bad data from Week 18. However, for a few, it unfortunately wasn’t possible to do so. I have filtered out all the teams that did not make the playoffs, so let’s see how the league’s elites stack up:
Offensive Data:
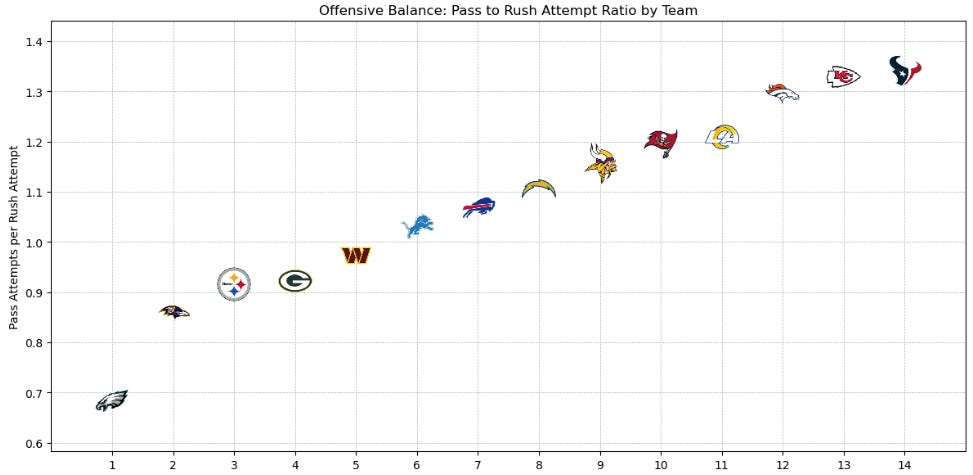
Quick Analysis: The Eagles are a bit of an outlier with how little they throw the ball. If you are somehow able to limit their rushing attack, they don’t want to become pass-heavy. The majority of the playoff teams have a Pass/Rush ratio of over 1 with the Broncos, Chiefs, and Texans slightly above the pack and unbalanced towards throwing the ball.
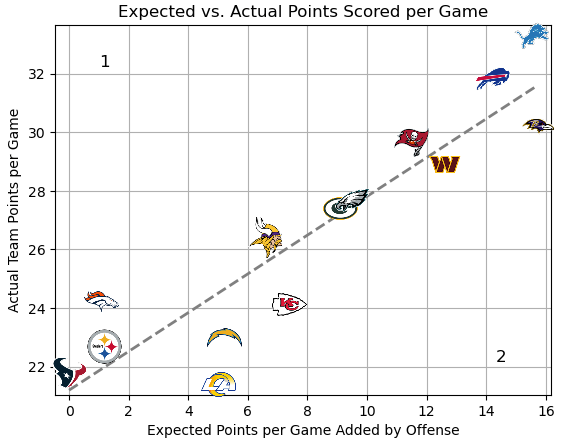
Side 1: ‘Overvalued’ Offenses
Side 2: ‘Undervalued’ Offenses
Quick Analysis: Based on EPA, offensive groups like the Rams, Chargers, and Chiefs could all be undervalued and might surprise us in the playoffs. Most groups are scoring as much as they ‘should be’ according to the two statistics. One offense that could potentially be overvalued and look worse than expected is the Broncos. While they averaged 24.2 PPG between Weeks 2-17, the advanced metric suggests they are about 2.4 PPG worse than that. For the Orb’s pick on the Bills, let's hope this is the case.
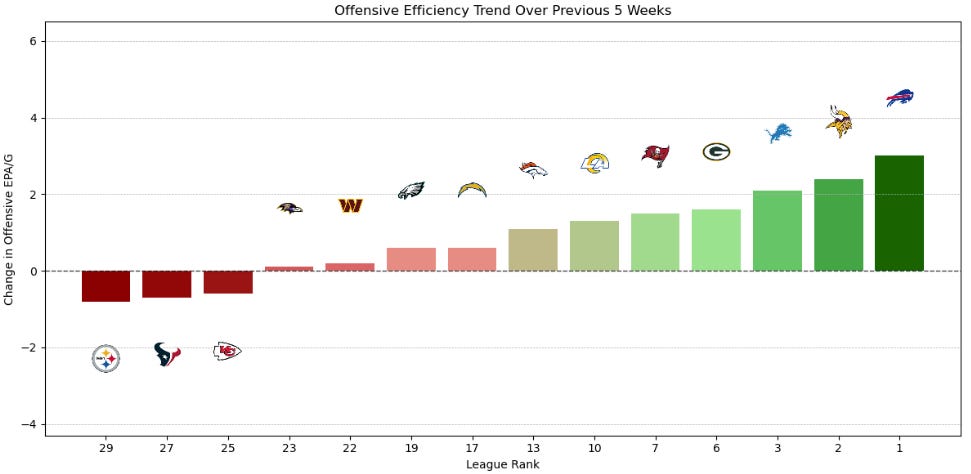
Quick Analysis: This graph shows the rise and fall of offensive EPA from Weeks 13 through 17. Teams above 0 have improved their offensive efficiency heading into the playoffs and are playing better now than they were 5 weeks prior. Teams below the line, Chiefs, Texans, and Steelers are trending downward offensively heading into the playoffs. For the Bills spread pick, let’s also hope they continue to play their best ball on Sunday.
Defensive Data:
Side 1: ‘Overvalued’ Defenses
Side 2: ‘Undervalued’ Defenses
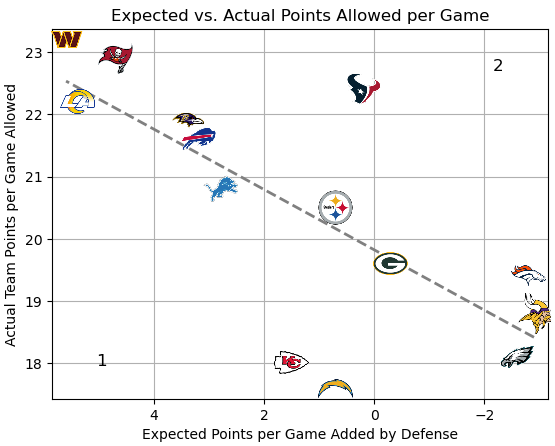
Quick Analysis: While the Chiefs and Chargers have allowed very few points this year, their efficiency suggests these units may be overvalued and ‘should’ be thought of as 20ish PPG-allowed defenses. Meanwhile, the Texans are the most glaring outlier on the Side 2. While they have allowed more than 22 PPG this year, their advanced metric suggests they might be undervalued and play more like a 20 PPG unit.
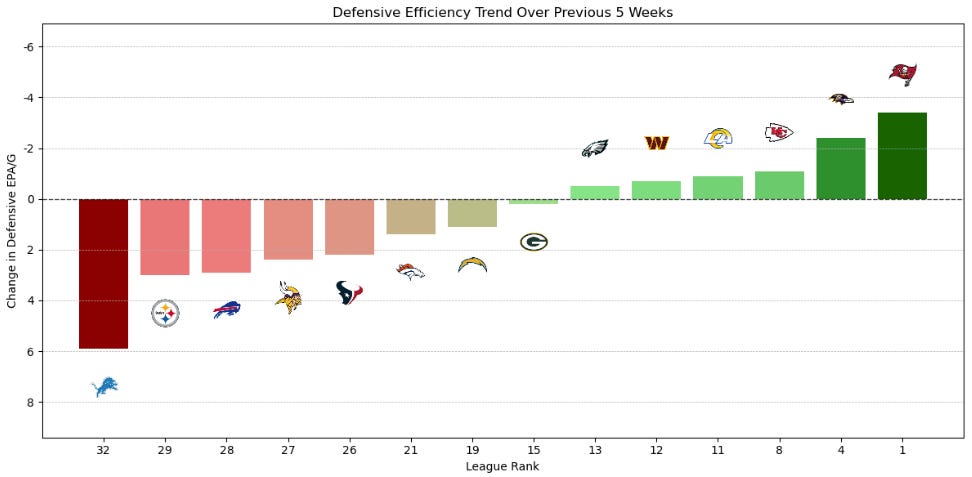
Quick Analysis: Because this is data from before Week 18, this graph does not see the impact of Detriot’s big defensive performance against the Vikings to win the division. But still, one good game may not be as significant as the impact of all their injuries between Weeks 13-17. The Buccaneers are the most positive trending defensive unit heading into the playoffs. They will have their hands full with Jayden Daniels so let’s see if this improvement is enough.
Overall Efficiency:
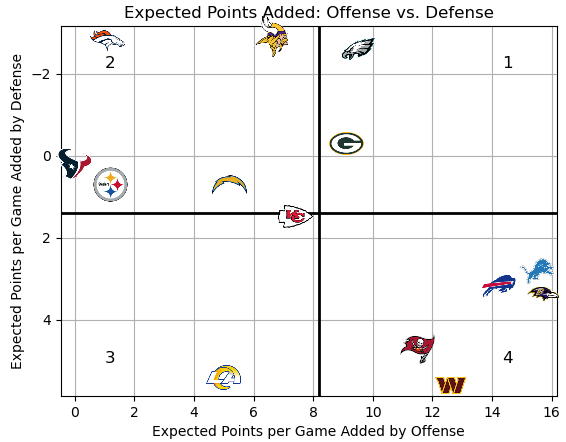
Quadrant 1: Above average offense/above average defense
Quadrant 2: Below average offense/above average defense
Quadrant 3: Below average offense/below average defense
Quadrant 4: Above average offense/below average defense
Quick Analysis: This is our overall efficiency graph comparing offense to defense. Throughout the season the averages were based on the entire league. Here they have been reset to see how each team compares to the best of the best overall. Only the Eagles and Packers are in the desired Quadrant 1, while the Rams find themselves alone below the elite average on both sides of the ball according to EPA.
Cover Rate Analysis:
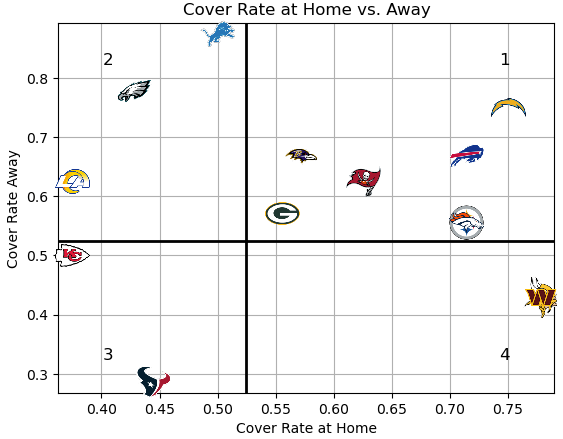
Quick Analysis: The cover rate graphs do not include data from Week 18. The lines here are set at 52.4%, the break-even profitability rate against the spread. The Commanders and Vikings have dominated against the spread at home, but each has been a good team to fade so far on the road. Meanwhile, teams like the Rams, Eagles, and Lions have all been better bets on the road than at home.
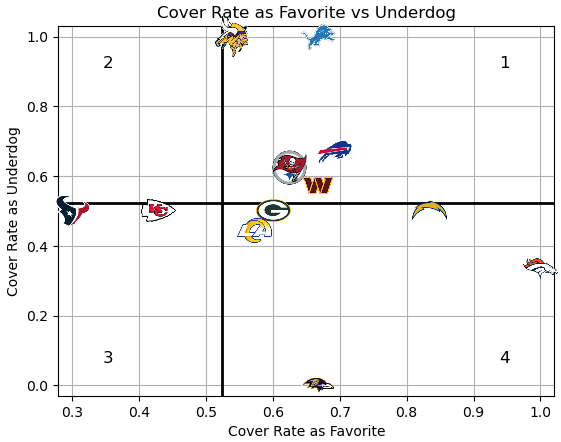
Quick Analysis: For some of these teams I think the Home/Away splits tell a better story than the Favoirte/Underdog ones. Teams like the Ravens and Lions were each underdogs just once. For Baltimore, it was their very first game, the Isaiah Likely ‘toe on the line game.’ For the Lions, it was Week 7 against the Vikings. Detroit happened to win and cover while Baltimore did not. Does that mean you shouldn’t take Baltimore because they covered 0% ATS (0/1) as an underdog if they go on to win and get points next week? Not necessarily. Or at least that shouldn’t be the reason you don’t take them to cover. The most interesting team here to me is the Broncos. As of when we give out picks on Friday Mornings, Denver has been favored 7 times. Unless I have messed up our data or put something in incorrectly, they have covered all 7 games. This means they have beaten up worse teams. But when Denver is the one getting points and they are playing a better team, they have covered just 3/9 times. This is yet another trend we hope continues on Sunday as they are getting a lot of points in Buffalo.
Since there is not an official Orb spread on the Eagles-Packers game, let’s use it as an example of how you could use all this information to pick a side on any of these games.
A Data-Driven Case for the Eagles -4.5:
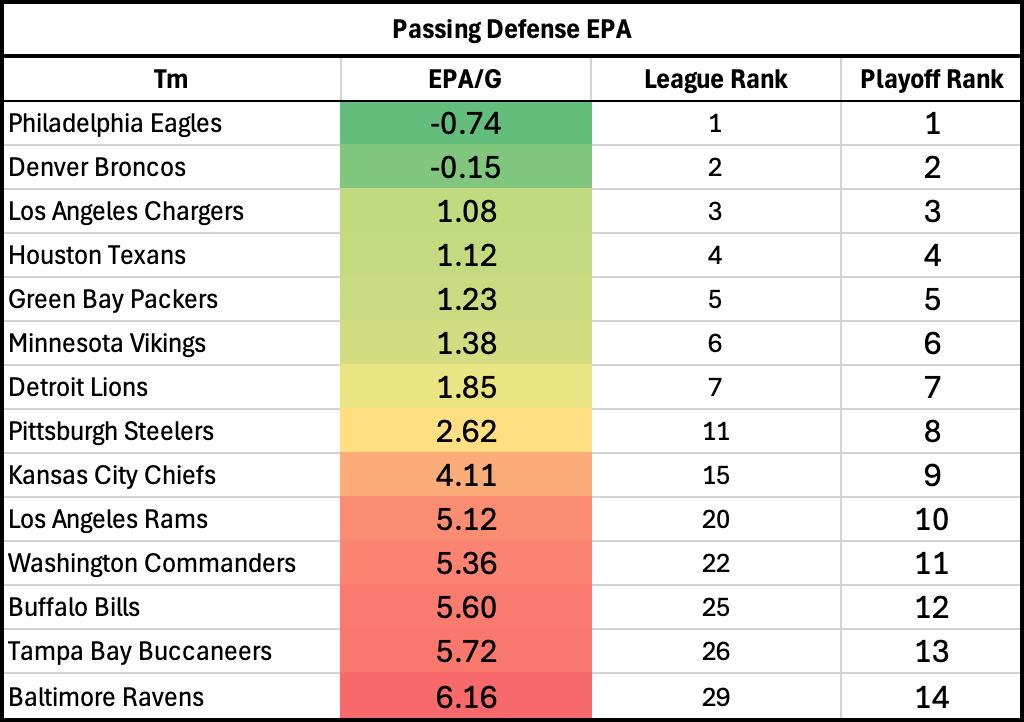
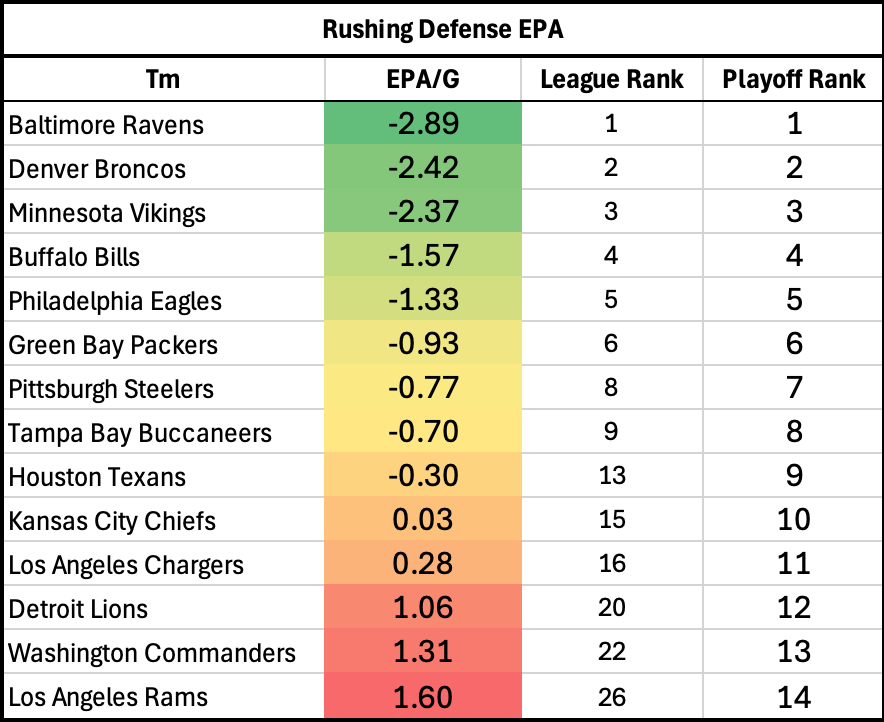
The Eagles running attack is elite. They rank 4th in EPA/Game on the ground and are doing so at the highest volume. They throw the ball just 0.7 times per rush attempt and have the lowest ratio in the league meaning they are handing it off at the highest rate. The Packers’ defense ranks 6th against the run by the same statistic. While the advantage may be in their favor in most matchups, this isn’t one of them. On the other side of the ball, the Packers' offense is fairly balanced but they rank higher in their passing attack than their run game. They were 8th in the league in passing EPA/Game and rank 7th among the playoff teams. This may also play into Philidalphia’s favor as the Eagles are firmly the #1 pass defense by the same metric. Green Bay may try to hand the ball off more than usual to avoid this, but the Eagles are also 5th against the run.
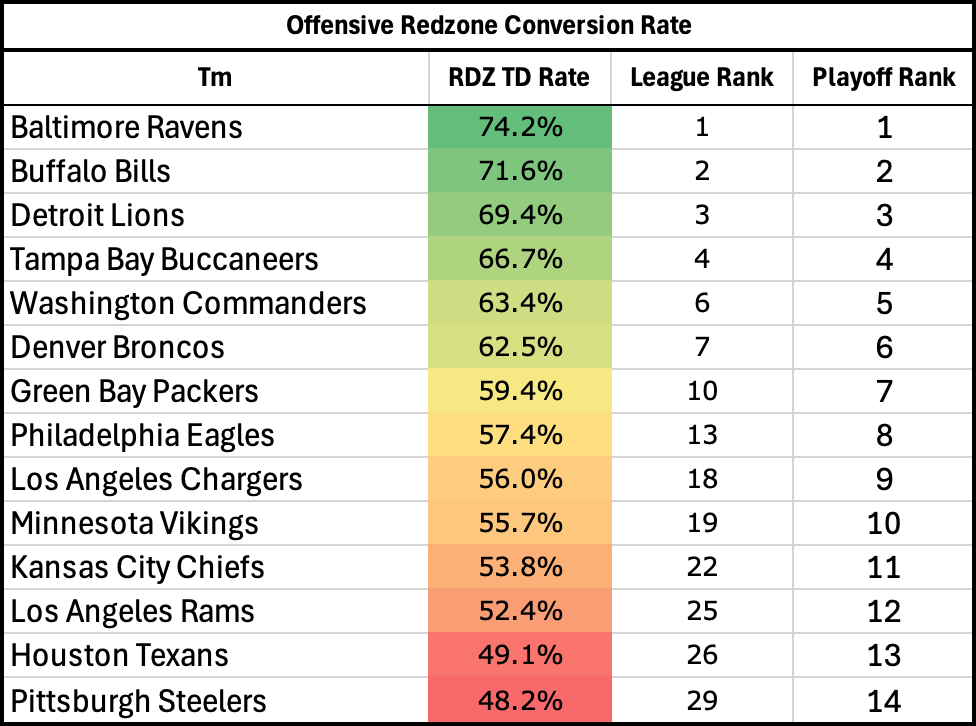
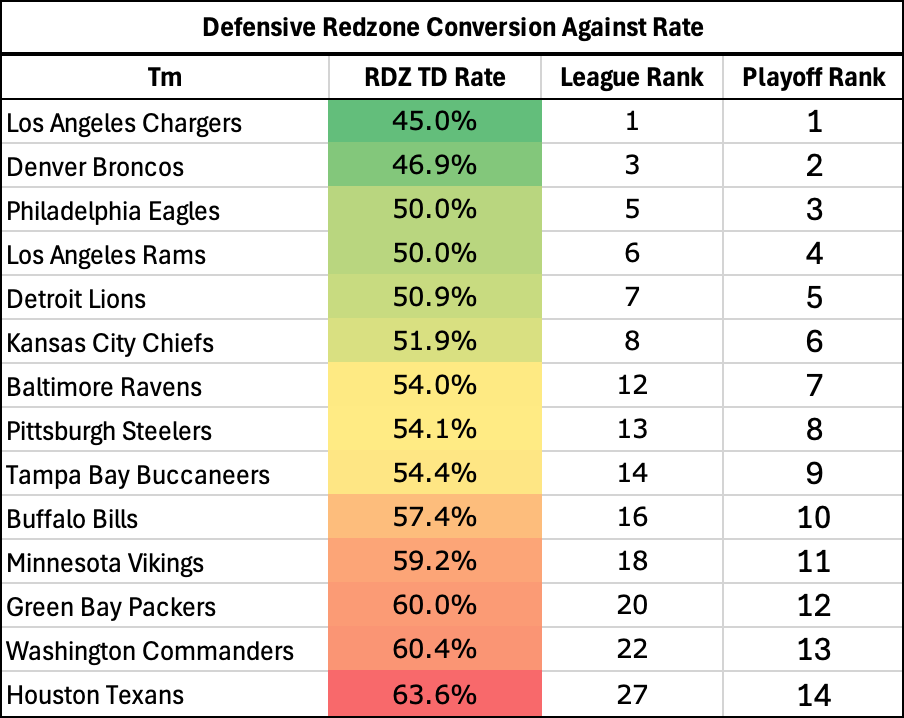
The difference between covering and not can often come down to converting in the redzone. While these teams rank 7th and 8th of the playoff teams in converting offensively, defense tells a different story. Philadelphia has been stout in the redzone and ranks 3rd among playoff defenses and 5th league-wide when it comes to keeping opponents out of the endzone. They are right at 50%, meaning it has been a coinflip whether or not a team has gotten in for 6. Green Bay ranks 12th out of the 14 teams left and 20th overall, allowing opponents to score 60.0% of the time in the redzone. If the ball ends up on the 1-yard line, I’m not sure this is the redzone defense that has a chance at stopping the inevitable tush-push, not that most do anyway.
A Data-Driven Case for the Packers +4.5:
When we reset these graphs to only look at the playoff teams, aka the best of the best, only two teams find themselves in Quadrant 1 of our overall efficiency graph. Meaning only two teams are above the playoff average according to EPA both offensively and defensively. And while one of them is Philadelphia, the other is Green Bay. So one of the only two teams that is elite on both sides of the ball is getting 4.5 points. The numbers above are season-long averages. Another important factor is your form going into the playoffs. Because the chart doesn’t include Week 18 due to bad data, the offense and defensive efficiency trends are looking at how teams either improved or declined over the last 5 weeks of meaningful football. The Packers were the 6th most positively trending offense in the league down the stretch, good for 4th amongst playoff teams. The Eagles rank just 19th in the league here. These two offensive find themselves in almost identical places in our Expected vs. Actual Points Scored per Game graph. This means they are actually scoring exactly as many points as they ‘should be’ according to EPA. But one of these units is greatly improving and playing their best now while the other one is stagnant.
Where this game is being played also could be a factor in who covers if our season trends continue. Removing Week 18, the Eagles covered in 10/16 games for a winning rate of 62.5% overall. But this doesn’t tell the whole story, as this team struggled to cover at home in Lincoln Field. For whatever reason, the Eagles covered in just 42.9% of their games in Philadelphia. Meanwhile, the Packers have been a good bet on the road, covering 57.1% of their games away from home.
Not all the arguments made above are equal, based on just the data I would say it slightly favors the Eagles covering but I wanted to highlight that it can be interpreted in many ways and there isn’t one clear side to take in any game. I hope this information is helpful in your playoff decision-making and please let us know if any of it leads to winning predictions!
- Team Orb Analytics
.
.
.
.
.
.
DISCLAIMER:
The information provided on this website is for informational purposes only. It is not intended to be gambling or financial advice, and should not be relied upon as such. We are not responsible for any actions or decisions taken by readers based on the information provided on this website.
The picks and predictions provided on this website are based on our own research and analysis, and are intended to be used for entertainment and informational purposes only. We do not guarantee the accuracy or completeness of the information provided, and we are not responsible for any losses or damages incurred as a result of using this information for gambling or other purposes.
By accessing and using this website, you acknowledge and agree to the terms of this disclaimer, and you assume all risks and liabilities associated with your use of the information provided on this website.


