
Orb Analytics NBA Model Beta Test Recap!
Presented by Novig – America’s #1 Sports Prediction Market


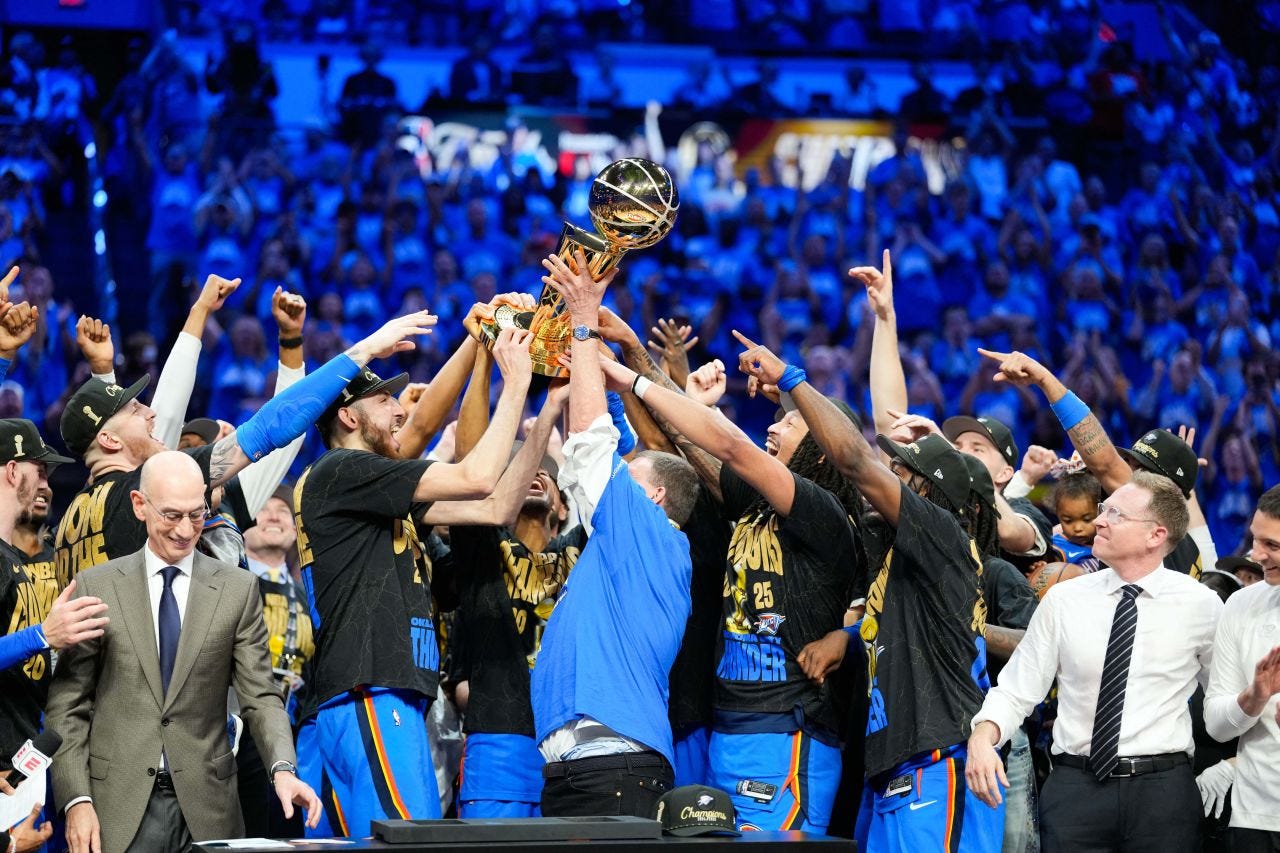
Image via https://www.cnn.com/sport
With the NBA season now over, we head into the ‘dead zone’ of American sports over the summer with just the MLB remaining. The end of the NBA season also means the official end of testing for our NBA model, so let’s break it down! On January 31st, I announced that we had developed version 1.0 of an NBA model and were turning the testing for it live to our readers. Internal testing is a crucial step in model development, but as a page based on transparency, I know that hearing about testing results retroactively doesn’t carry nearly as much weight as seeing it happen live with your own eyes.
To keep it simple and not flood your inboxes daily, we decided to post the model’s predictions on Tuesdays and Thursdays until late in the playoffs, when there weren’t enough games to do so, and we had to cooperate with Adam Silver’s schedule. So before we get into the results, it’s worth noting that this was not a full test, but rather a quasi-random approximation. Since the picks were made on a set schedule, this wasn’t a truly random sample, but because those days fairly represent the overall schedule and betting markets, this test structure still provided a reasonable reflection of the model’s predictive ability. Now that we have the fancy data analyst disclaimer out of the way, let’s finally dive into the numbers behind the 72 predictions our model made across 34 days of posting.
Beta Test Results:
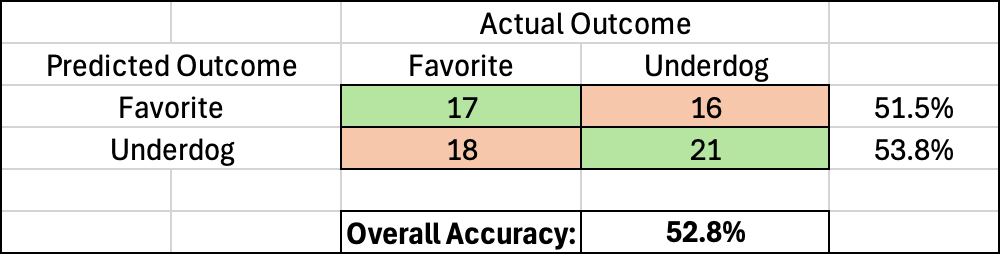
Beta Test Overall Record ATS: 38-34, 52.8%, +1.4 units
Playoff Record: 13-10, 56.5%, +2.5 units
In the announcement for our NBA model linked here, I specifically mentioned that we were too early in the process for accuracy to be the main focus. Just starting to expand our product offering into a new sport was a win for Orb Analytics. But 72 predictions later, we have results to talk about.
The model finished with an overall record of 38-34, good for an accuracy of 52.8%. It overindexed slightly to one of the classes, predicting the underdog to cover 54.2% of the time compared to giving out the favorite in 45.8% of games. Thankfully, similar to our NFL model this season, the NBA model actually performed better when predicting the side that it gave out more often. In a perfect world, we would want consistent accuracy across both class predictions, but in reality, if it is going to perform better on one side, we love that it's the one with a higher volume of picks.
How did we get to the numbers above? Let’s take a look at the model’s overall accuracy and unit performance throughout the 34 days of picks:
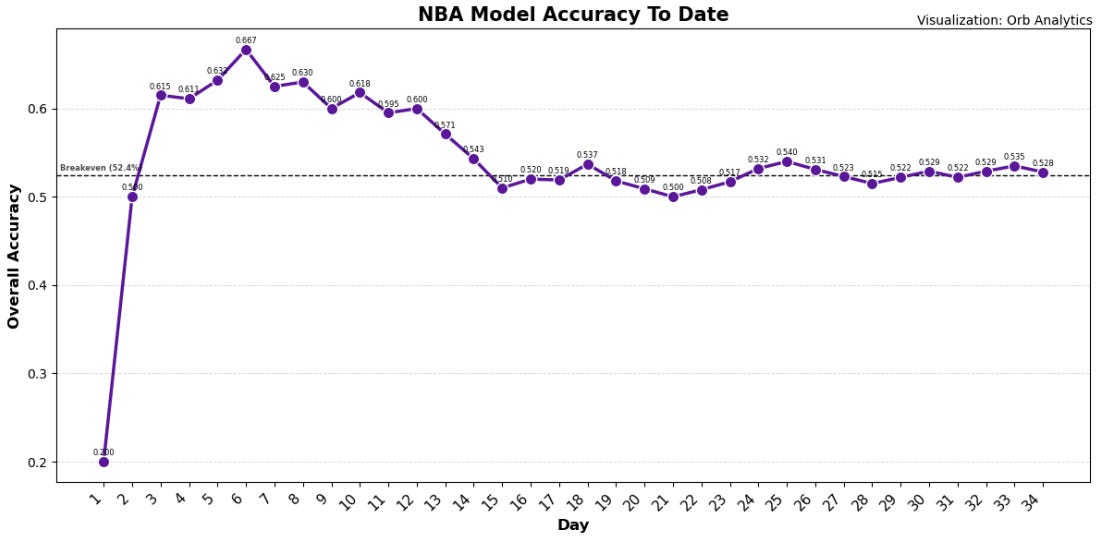
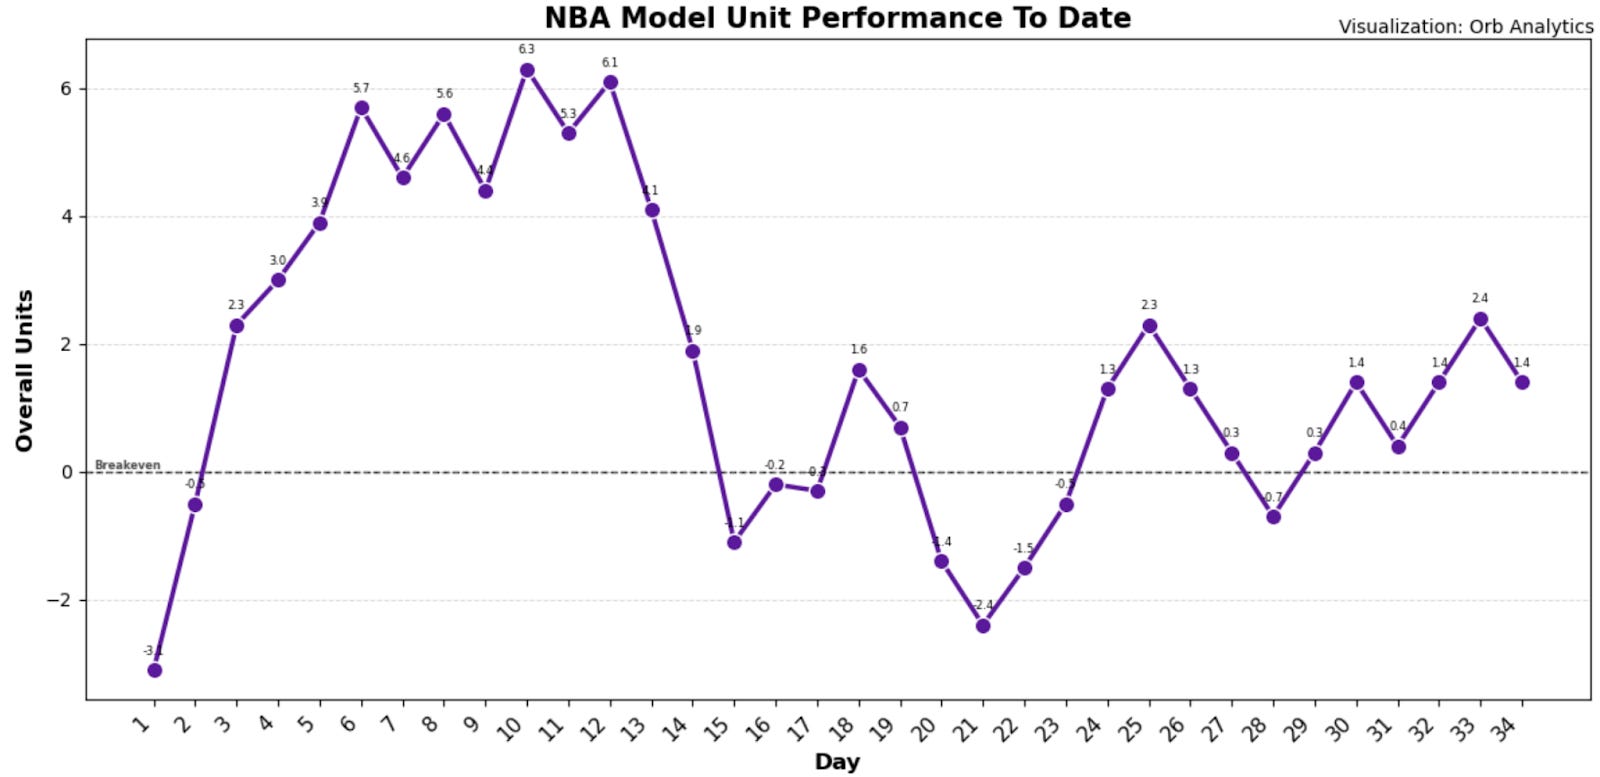
The first datapoint that jumps off the screen and needs to be addressed happens to be Day 1. Just like our NFL model did in its first week this season, the NBA model opened the live test with a 1-4 performance against the spread. This started us off with an abysmal 20% accuracy rate and in a -3.1 unit hole that it would have to dig itself out of. Thankfully, the model did just that with 5 consecutive winning performances, which equated to an +8.8 unit turnaround and brought the overall accuracy up to its peak of 66.7% after Day 6.
Days 3-12 were the most successful for the model as it was steadily between +2.3 to +6.3 units. During this time, I noted that the model’s accuracy was “too high” and that even the best models in the world wouldn’t be able to maintain this accuracy ATS in the long term. This immediately came true as the model had a significant losing streak between days 13-15 in which it dropped 9% in overall accuracy. This brought the unit record below 0, so the model was losing to the market for the first time since day 2.
From day 15 on, we saw more normal, expected results from the model. Smaller ups and downs in accuracy and corresponding unit performance, but generally trending upward, which is the goal. During this stretch, the model hit its 2nd lowest point of the season when it exactly reached the expected 50% accuracy on spread predictions. This resulted in sitting at -2.4 units overall on day 21. From here, the model once again responded well with 4 consecutive winning performances that raised the winnings from -2.4 to +2.3 units. During this final stretch of the season, the model bounced right around the key 52.38% accuracy mark, weaving slightly above and below it. Even with missing on the final prediction of the season, the model finished above that all-important number with an accuracy of 52.8% and +1.4 units to show for it.
Did We Pass the Test?
As I mentioned above, this has been our first step in expanding our predictive product offering into new markets and across more of the calendar year. So it is a little unfair to say, but this test was a “success” the second we started it. While I didn’t think we were ready to measure the model’s accuracy against any benchmarks, it ended up clearing the high standard that we put our NFL model against in being profitable against an average -110 spread bet. With just a 72-game sample, we would have needed an unrealistically high hit rate to prove the statistical significance of the model’s predictive ability. But that doesn’t mean the odds of going 38/72 or better were in our favor. Assuming the 50% probability of spreads, we had just a 36.2% probability of hitting at or above the accuracy that we did. Meaning that 63.8% of the gambling population would have done worse and guaranteed that they lost money to a sportsbook. Considering that we *only* finished 0.4% above the profitability threshold of an average -110 spread bet, and that we had just over a 1/3 chance of doing at least that well over the sample size, you can start to see how much the math is against you (or our models) of being profitable when predicting spreads.
If you have read our work for a while, you know that part of transparency is having an honest definition of what “success” means in this crazy game. Sportsbetting personalities and influencers lie to you constantly. Through manipulating data and hiding results when their picks lose, influencers have convinced many that it is possible to hit accuracy benchmarks and unit returns that are mathematically impossible in the long run. This game is rigged against you, the player, by the big sportsbooks. Being profitable when the deck is stacked against you over any sample size (but especially a large statistically significant one) is a huge win! Every time you make money over the long term, you have defied the odds and are part of a tiny percentage of people who have done so.
If we had picked exactly 50% against a -110 bet, the most likely outcome, we would have been down -3.3 units. So while +1.4 units doesn’t jump off the screen, it outperformed the expected return by +4.7 units. Thankfully for us, we didn’t bet against the high -110 average price all season. Price is just as important as accuracy is for measuring unit winnings. On March 18th, we announced our partnership with Novig and started using their prediction market prices instead of a sportsbook. By cutting out the traditional vig and instead buying directly into the market, we dropped our average price from -110 down to -105.5. This, in turn, lowered our breakeven accuracy from 52.38% to 51.34%. Over a large sample size of predicting 50-50 outcomes, that 1.04% edge back in our favor could have been the difference between winning money and losing money. In the playoffs, we saw the markets get even more efficient with a higher volume of players and more liquidity. This led to an average price of -103.4 in the playoffs, which translates to needing to hit just 50.83% of picks to break even.
That's why partnering with Novig and playing on their prediction market is a win-win for us. We get better prices on the same plays, which directly rebalance the odds back in our favor. We promote them to you so that you can join in, get better prices, and increase your chances of winning in the long term on Orb and non-Orb predictions. Help support us and your bankroll by telling them we sent you and use code “ORB” for 50% your first purchase up to $25 on the button link below.
🏀🚨 Orb NBA model picks are brought to you by Novig!
🚀 Sign up today & use code ‘ORB’ for 50% off your first purchase up to $25
🔥 Play Smarter with Novig – America’s #1 Sports Prediction Market 🔥
✅ Better Odds – Play against real users, with no house cut (VIG)
📲 Click the button below to download Novig from the app store - Must be 21+
Check out what our NBA guys have to on their Finals recap pod below:
Dishing + Swishing: EP30 - Rings, Rumors, and Rebuilds
- Team Orb Analytics
.
.
.
.
.
.
DISCLAIMER:
The information provided on this website is for informational purposes only. It is not intended to be gambling or financial advice, and should not be relied upon as such. We are not responsible for any actions or decisions taken by readers based on the information provided on this website.
The picks and predictions provided on this website are based on our own research and analysis, and are intended to be used for entertainment and informational purposes only. We do not guarantee the accuracy or completeness of the information provided, and we are not responsible for any losses or damages incurred as a result of using this information for gambling or other purposes.
By accessing and using this website, you acknowledge and agree to the terms of this disclaimer, and you assume all risks and liabilities associated with your use of the information provided on this website.
 | A guest post by
|
 | A guest post by
|