


2024 Regular Season Recap


Welcome to Orb’s 2024 Regular Season Recap! This was our second official season on the record books and we have a lot of numbers to break down for you. While it was another successful year in which we achieved our main goal of hitting at least 52.4% against the spread, we took an interesting path to get there. The models went through high-highs and some record breaking low-lows, but ultimately the wins outweighed the losses and finished with back-to-back seasons above 55% against the spread and winning double-digit units overall. These are both benchmarks that we are extremely proud to have hit in consecutive seasons.
Before we get into the season numbers, last week’s ‘picks’ came with a heavy disclaimer that Week 18 is bad data due to most teams resting players for the playoffs or trying to improve their draft position. Therefore just like Week 1, it was just an exercise and not part of our official season. Successfully modeling the unpredictability NFL is an uphill battle even when we have the best available data and every team is trying to win. But our core belief here is transparency, particularly when it comes to any picks the models make, even if they are unofficial. So here is yet another example where bad data in led to bad results out:
Spreads:
Panthers +7.5 ✅
Commanders -6.5 ❌
Bills -2.5 ❌
Chiefs +10.5 ❌
Rams +6.5 ✅
All spreads: 2-3, 40%, -1.182 units
Moneyline:
Ravens ✅
Falcons ❌
Commanders ✅
Packers ❌
Colts ✅
Bills ❌
Eagles ✅
Buccaneers ✅
Chargers ✅
All moneyline: 6-3, 66.7%, -0.779 units.
Overall an unofficial -1.961 unit performance from bad data. Let's get into the official numbers with some tables and graphs that you’ve seen before as well as some new ones:
Individual Model Performance:
Season spreads:

Season moneyline:

Models A and C tied for the best individual model as C performed slightly better against the spread, but A had the edge on moneyline picks. Model B finished in last place for both bet types and just like last year’s version of Model C, may be replaced this offseason. Throughout the season I have been live testing two new model types behind the scenes that have shown some real promise including another attempt at a linear model to give us our own predicted line. This offseason I will spend more time back testing them to see how well they combine with other model types ahead of next season. But while backtesting is the next best thing, nothing compares to the real-time results of live testing when you have the opportunity to do internally.
Official Orb Picks Season Results:
Season spread picks: 45-36, 55.6%, +5.0 units
Season moneyline picks: 106-42, 71.6%, +6.9 units

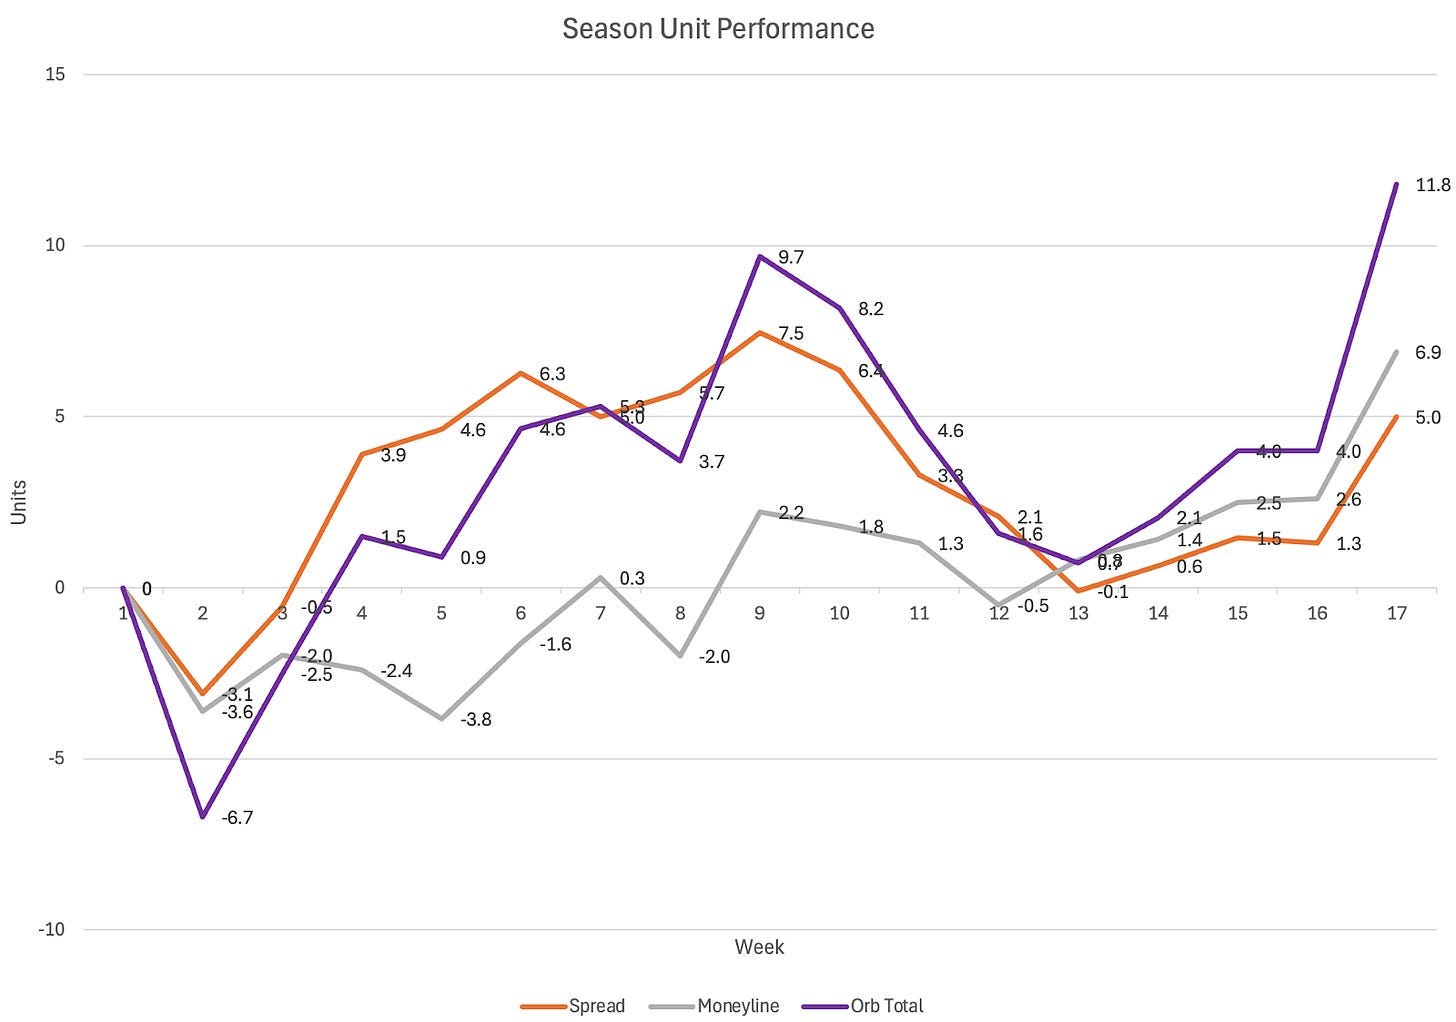
The Orb’s performance this season can be broken down into 3 parts:
Part 1 was Weeks 2-9. After a disastrous first week of our official season (Week 2) in which the models dug us in a 1-4 ATS record and -6.7 unit hole, the Orb bounced back in a big way. It only had one more slight losing week against the spread during this stretch and peaked at +7.5 units and 60.1% ATS. Overall it was sitting at +9.7 units.
Part 2 was Weeks 10-13. This was the Orb’s worst-ever performance slide to date and hopefully is a record we never break. The model’s overall unit performance dropped from +9.7 units to just +0.7. More devastating, the season-long accuracy against the spread dropped from 60.1% to 52.3% meaning we were sitting 0.1% below our season goal of the 52.4% profitability line. So if the season had ended after week 13, it technically would have been an unsuccessful season by 0.1% as far as we are concerned.
Part 3 was Weeks 14-17. The Orb once again showed resilience and bounced when things weren’t going our way. After our historic performance slide, our models finished the season strong, adding +11.1 units to the season total and more importantly, bringing our season-long accuracy against the spread up to 55.6%.
While ‘volatile’ is a word that comes to mind when I look at the graph above, the winning weeks certainly outweigh the losing ones and at the end of the day, I will take that. My goal of consistency continues with the dream of more up weeks and smaller down ones. But even with the worst start to the year imaginable and our worst-ever string of performances, this chart shows me that this year was nothing but a success! This is especially true when we compare the Orb to an ‘average bettor’ later on.
Confusion Matrix:
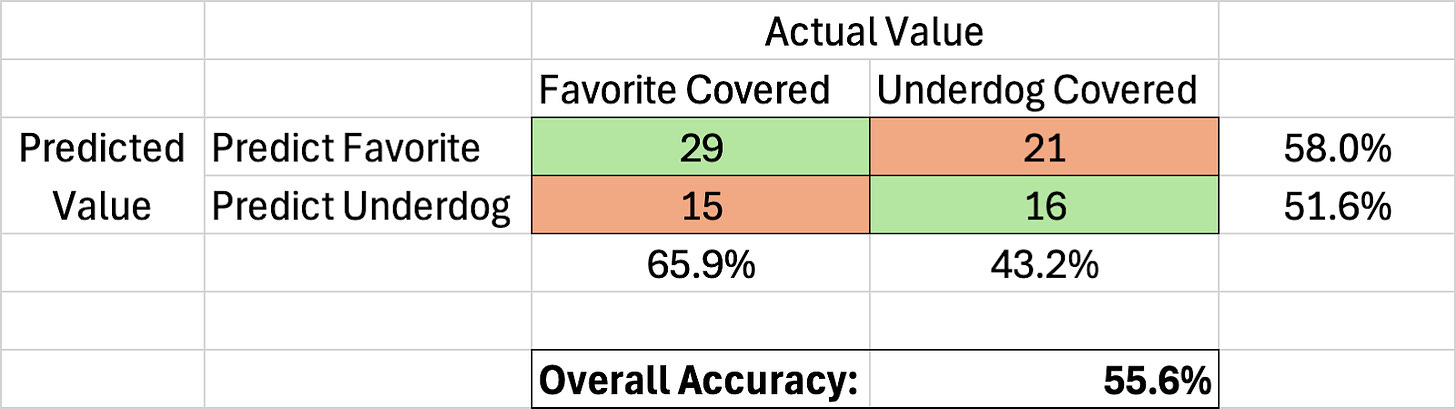
Later in the season, I was worried that our models were over-indexing on favorites. It felt like most of the picks we were giving out were on the favored team to cover and they felt like very ‘chalky’ or ‘public’ predictions. And that is because they were! Out of the 81 official spread predictions that our models made this season, 50 of them were on the favorite to cover. So the models were heavily unbalanced, predicting one of the outcomes 61.7% of the time. The good news for us is that the actual outcomes were also unbalanced in favor of the favorites. During the Orb’s official season of Weeks 2-17, favorites covered in 134/240 games or 55.8% of the time. You may not remember because it feels like so long ago, but underdogs dominated in the first few weeks. So, the cover rate from favorites actually jumps up to 59.9% of games when we look at games from Week 5 and beyond.
As you can see in the matrix above, the Orb hit at a higher rate on the side that it over-indexed on. The Orb’s performance on underdog predictions actually hurt our overall performance as it picked below the 52.4% threshold when taking the points. If we had only gone ‘chalk’ and never given out a single underdog spread prediction, our season accuracy would have been 2.4% higher at 58.0%. But considering that underdogs only covered 44.2% of the time, our model outperformed the rate they actually covered by 7.4%. On the flip side, even though favorites covered at such a high rate, you would have had a 2.2% better chance at hitting on an Orb favorite than you would have randomly picking one against the spread.
If you have been following us for some time now, you have heard me say 100 times that we have one main Northstar goal each season and that is to pick above 52.4% against the spread. While this is true, I did set some specific secondary goals for our spread and moneyline models that I thought would be interesting benchmarks in a perfect season. I have copied them over from our season kickoff post before Week 1 to review:
Regular season spread goals:
Hit above 52.4% ✅
We hit at 55.6% against the spread. In our kickoff post, I wrote: “This is our single biggest goal each year. If the Orb hits this and misses the rest I will still consider it a successful season”
Hit above 52.4% when predicting both the favorite and the underdog to cover ❌
As seen in the Confusion Matrix above, the models hit above the target when predicting favorites, but picked just 51.6% when predicting underdogs.
Have ‘high’ value picks hit at a higher rate ❌
This was our biggest miss of any of our goals. Creating a successful model confidence is a big focus of mine and this year’s attempt was a swing and a miss. The ‘golden metric’ we used this season to calculate model confidence worked great when backtesting against last season, but did not work this season. In order, the most accuracy confidence levels were ‘Medium’, ‘Low’, and then ‘High’ in last place, ironically. Back to the drawing board for this next season!
Have at least one model hit above 52.4% on its own for the whole season ❌
None of the models hit above the profitability threshold on their own. Model C was the closest, finishing the season at 51.7% against every game.
Regular season moneyline goals:
Be profitable ✅
With each game having its own unique odds and big favorites sitting at crazy -money, this goal is my way of standardizing our moneyline goals. We are happy to say that we achieved this goal as the moneyline model finished the season +6.9 units.
Hit over 50% when predicting the underdog to win outright ❌
Each individual moneyline model predicted the favorite to win outright at 80.8%, 72.9%, and 79.6% of the time respectively. So it was rare that all three aligned to agree that the underdog would win in a +money upset. It happened just 10 times this season and hit on 4 of them for a 40% win rate, below our goal. The positive spin is that the underdogs actually won just 27.9% of the time, so the Orb was 12.1% better at predicting underdog upsets than blindly picking one to happen.
Hit at a higher rate than blindly picking every favorite to win. ❌
Favorites won outright 72.1% of the time between Weeks 2-17. Our moneyline model finished the season with a 71.6% accuracy rate. So we just missed out on this goal.
While we hit on our Northstar goal for the season as well as our main target on moneyline picks, we missed on the rest of our secondary goals for the year. While these are still great benchmarks to strive for in the future, I won’t be too harsh on the models as this was still another successful season for the Orb, even if it wasn’t perfect.
The Orb’s All-Time Record:
This is now our second official season on record so we can zoom out and look at how things stand for our models overall going back to the 2023 season. Here are the official numbers:
2023 Season:
Spreads: 60-42-7, 58.2%, +12.542 units
Moneyline: 116-47, 71.2%, +10.562 units
Total Units: +23.104
2024 Season:
Spreads: 45-36, 55.6%, +5.0 units
Moneyline: 106-42, 71.6%, +6.9 units
Total Units: +11.8
Overall Record:
Spreads: 108.5-81.5, 57.1%, +17.5 units
Moneyline: 222-89, 71.4%, +17.5 units
Total Units: +34.9
For simplicity of the graphs, this season I switched our rounding of unit performance from 3 decimal points to 1 so that is the reason behind any minor discrepancies in our unit numbers. I couldn’t be more proud of our models for the numbers above. Being +34.9 units after two official seasons is surreal. More interestingly to me, our spread and moneyline models are both sitting at the exact same number of +17.5 units. While we put more internal emphasis on our spread models, the moneyline ones have produced the same results. So while it it may feel bad to give out (or take) a heavy favorite pick that risks 1 unit to win 0.1 units, it all adds up in the end.
Sitting at 57.1% overall against the spread over two seasons is beyond my wildest expectations for the models. There is a reason we don’t reset our season goal based on past performance. Hitting at or above 52.4% against the spread is always the main objective. While the 2.4% difference between that number and a ‘coin-flip’ 50% performance doesn’t sound like a lot, it is everything in this game we play. The Vig on spread picks is where Vegas makes millions and you the player lose your bankroll in the long term. While the odds change as a spread line moves, they average -110, and most eventually find themselves right there. With a $10 unit size, this means you risk $10 to win $9.09 from the sportsbook or are losing 9.1% of the value of your bet before the ball is even kicked off. The $0.91 here might sound as insignificant as the 2.4% difference above, but let’s look at it visually.
If you take nothing else away from our content throughout the year, please let it be the red line below showing how mathematically rigged this game is. For this exercise, I compare the Orb’s spread bankroll results against a gambler who picks exactly 50%. Again, while the implied odds of an individual spread may not be exactly 50% due to ‘sharp money’ and other factors, as you pick against a larger sample size the expected accuracy goes to 50%. Both accounts start with $100 and have a $10 unit. Each makes straight, single-unit bets and does not roll over winnings on their bets. The sample size we are looking at is the 190 official picks that the Orb has made over the last two seasons. For simplicity, I have made it so the 50% bettor alternates between winning and losing their picks. So they win the first bet, lose the second, win the third, and so on. The cool thing about addition is that with the same final accuracy, they could win/lose the 190 spread bets in any order and their bankroll would end up in the exact same place. Here are the results:
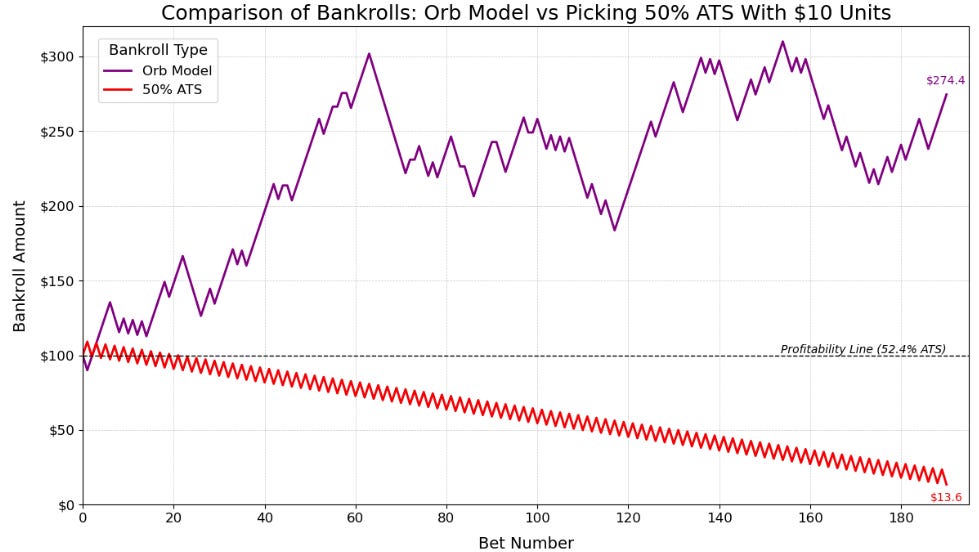
After winning their first bet and having their bankroll sit at $109.09, we see just how much the Vig crushes gamblers in the long term. After 190 spread bets picking at 50%, their account that started at $100 is now sitting at just $13.6. They would have lost 86.4% of their bankroll over two seasons just by hitting at the statistically expected rate. Image if they picked below 50% as many of us do. If a stock’s most likely outcome was losing 86.4% of its value in two years, you would never buy it. But when the sportsbooks give us those same odds, we blindly take them and think we have a chance of making money without any statistical edge like a predictive model.
You would need to hit 52.4% in the long term just to stay at $100 and find yourself along the black dotted line. This red line is also why the books don’t want you to pick 0%. If you missed your first 7-10 picks, you would most likely quit. If you hit anything below 52.4%, which the vast majority of the population does you will feel like you’re in the game but Vegas will slowly pull all the money out of your account. More money in the long term than if you missed 10 in a row and never bet again.
The other super cool line (and shameless plug) on this graph is the Orb’s bankroll against the spread on its 190 spread predictions over the last two seasons. Over the same sample size, the Orb’s bankroll is sitting at $274.4, up 17.5 units (the 0.1 unit discrepancy is due to the rounding error mentioned above). Picking 57.1% against the spread added 17.5 units more than if the model were to break even with a 52.4% performance and has outperformed the statistically expected 50% ATS by 26.08 units so far or in this case by $260.8.
This graph has helped put a lot in perspective for me and for this project. As you can clearly see, our graph has downturns. When it comes to model performance, the only thing we can guarantee is that the Orb will miss picks. Losing picks, losing weeks, and even though we thankfully haven’t experienced one on record yet, losing seasons are statistically inevitable. The first two are seen here. We have even seen multiple losing week performances in a row. But when I compare them to the inevitable downward trend of picking 50% they don’t seem quite so bad when you zoom out and see our graph as a whole. If you are looking for a person or a model that ‘guarantees’ nothing but winning picks, winning weeks, and winning seasons, Orb Analytics and sports betting in general aren’t for you. It simply is not mathematically possible.
To dive a little further into that, I re-ran our Z-test from the halfway point of the season, now looking at the Orb’s entire record on spread picks. Z-tests require some assumptions, the biggest of which is that the expected accuracy of predicting spreads over the long term is 50%, which aligns with the inherent randomness of betting markets and game outcomes. Here are the results:
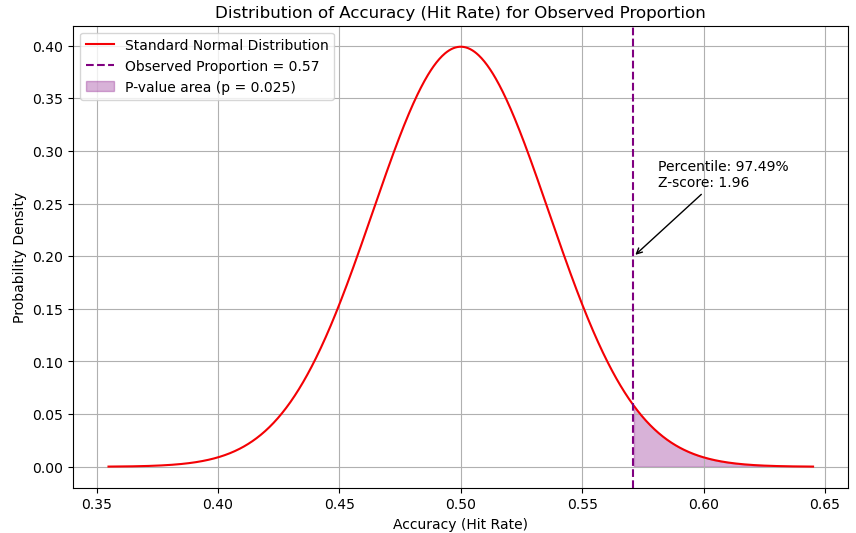
The Orb’s accuracy of 57.1% over a 190-pick sample is 1.96 standard deviations above the mean of 50%. This once again exceeds the threshold for statistical significance, suggesting our models show strong predictive performance. This accuracy also puts us in the top 2.51% of the population given the sample size and assumptions.
Based on those same metrics, 74.59% of the population is below the breakeven 52.4% mark. So statistically, 3/4 spread gamblers will find themselves below the breakeven dotted black line from the prior graph. With only about 1/4 players having a mathematical chance at getting to breakeven, let alone significant winnings. No wonder the house always wins. Vegas is not in the business of losing money and the rules they set us up to play by all but guarantee that.
We now turn the Orb’s attention to the playoffs! I am always curious to see how the models perform in the postseason due to the small sample size of games and lack of updated data. We saw in Week 18 how bad data can lead to bad results. A Chiefs team resting all their starters certainly did not represent the data Mahomes and the 1st-stringers put up all season. Since many of our predictors don’t update in the playoffs, our models will see these teams as they were after Week 17, with the final week being withheld for the same reasons. Again, even with the best available data accurately predicting the future of NFL results is extremely difficult as shown by the analysis above. So our playoff picks have less up-to-date predictors and are predicting against a smaller sample size of games. This is why our models are built for the regular season and why that is the performance that goes on our official record. However, we still run the models for the playoffs and are hoping to end up north of the profitability line by the end of the Super Bowl. So be on the lookout Friday Morning for the Wildcard Weekend picks, as well as a ‘Playoff Guide’ full of descriptive analytics that could help you inform your own data-driven decisions.
Thank You Orb Faithful!
As always, thank you so much for supporting the page and reading our content. Running the Orb project with Andy is a dream come true and none of it would be possible without the readers. Little things like reading a post, sharing the page with friends, or upgrading to a paid membership to support us go further than you could imagine. It has been another crazy NFL season with ups and downs for the Orb model, but ultimately, and thankfully, another successful one in the books. The best football is still ahead and the Orb’s picks aren’t going anywhere. Happy New Year and best of luck to anyone whose team is in the playoffs as well as the rest of us betting on it.
- Team Orb Analytics
.
.
.
.
.
.
DISCLAIMER:
The information provided on this website is for informational purposes only. It is not intended to be gambling or financial advice, and should not be relied upon as such. We are not responsible for any actions or decisions taken by readers based on the information provided on this website.
The picks and predictions provided on this website are based on our own research and analysis, and are intended to be used for entertainment and informational purposes only. We do not guarantee the accuracy or completeness of the information provided, and we are not responsible for any losses or damages incurred as a result of using this information for gambling or other purposes.
By accessing and using this website, you acknowledge and agree to the terms of this disclaimer, and you assume all risks and liabilities associated with your use of the information provided on this website.
Another successful season for the Orb! Pumped to see how the linear regression model effects the outcome next year